See what your AI agent actually did: hands-on with Arize Phoenix observability
Three frontier agent models shipped in 48 hours. The question isn't whether you can build an agent — it's whether you can see what it did. This tutorial wires a local agent to Arize Phoenix, traces every call, and turns the results into evals and experiments — no API key, no cloud, no cost.
- Phoenix 21.0.0 serves its UI and OTLP HTTP endpoint on port 6006, OTLP gRPC on 4317. Two lines —
register()plus auto-instrumentation — trace every OpenAI-compatible call. - Traces are span trees: an agent span contains retriever and tool spans and LLM spans; each LLM span carries the prompt, the response, the token counts, and the latency.
- Failed calls are traced too: a model call that dies mid-generation shows up as an ERROR span with its duration — the trace is where you find out, not the logs.
- Evals are two kinds: an LLM-as-judge classifier for open-ended quality, and a deterministic code check for facts you can test exactly. Run both; trust the code check when they disagree.
- Experiments settle arguments: the same dataset under two prompts, scored the same way. In this tutorial the with-policy prompt beats the bare prompt on every example by the fact check (4/4 vs 0/4); the tiny local judge agreed on three and misread the fourth.

Three frontier agent models shipped in 48 hours — GPT-6.2 Astra on November 17, Gemini 4 Neon on November 18, Claude Fable 5.2 in the same window. Everyone is building agents now. Almost nobody can see what theirs actually did.
That is the gap Arize Phoenix fills. Phoenix is the open-source observability platform for AI applications: it records every LLM call, tool execution, and retrieval as a trace, scores outputs with evaluators, and turns repeated runs into datasets and experiments you can compare. It is built on OpenTelemetry and OpenInference, so the instrumentation is a standard, not a vendor lock-in.
This tutorial wires a small support agent to Phoenix and takes it through the full loop: first trace, reading the trace, scoring it, and proving a prompt change with an experiment. Everything runs locally — Phoenix on your machine, the model on your machine via Ollama — so there is no API key, no cloud account, and no bill. Every command and every number below was verified by running it.
What you’ll need#
- Python 3.12 and
pip(oruv). - Ollama with a small local model — this tutorial uses
qwen3:0.6b, a 0.6B-parameter model that runs on CPU. Any model Ollama serves works; the code talks to Ollama’s OpenAI-compatible endpoint athttp://localhost:11434/v1, so you can swap in a larger model later without changing the instrumentation. - No API key, no account, no cost. Phoenix runs on your machine and stores its data in a local SQLite database.
- About 30 minutes, most of it waiting on the small local model.
Two honest caveats up front. First, the model here is tiny — a 0.6B model thinks out loud and answers slowly on a shared CPU (the generations in this tutorial took 36 to 103 seconds each). The observability patterns are identical with a frontier model; only the latency and the answer quality change. Second, this tutorial was verified in a sandbox with several other jobs running, where Ollama’s model runner was occasionally killed mid-generation. The agent code below retries a failed call up to three times, which is good practice for any local setup.
Step 1: Start Phoenix#
Phoenix is a Python package. Install it together with the OpenTelemetry registration helper, the OpenAI SDK, and the OpenInference instrumentation for OpenAI:
pip install arize-phoenix arize-phoenix-otel openai openinference-instrumentation-openaiVersions verified for this tutorial: arize-phoenix 21.0.0, arize-phoenix-otel 0.17.3, arize-phoenix-evals 3.10.0, arize-phoenix-client 3.7.0, openai 3.55.1, openinference-instrumentation-openai 0.1.74, on Python 3.12.3. (If you use uv, the same package list works with uv pip install.)
Start the server and leave it running:
phoenix serveOpen http://localhost:6006 — you should see the Phoenix UI, an empty project list. Verify from the terminal too:
curl -s -o /dev/null -w "%{http_code}\n" http://localhost:6006/
# 200
Phoenix serves the UI and the OTLP HTTP trace endpoint on the same port, 6006 (traces arrive at /v1/traces); OTLP gRPC listens on 4317. On first start it creates a SQLite database (by default at ~/.phoenix/phoenix.db) and runs Alembic migrations. If a first start fails during migration — it did twice in this tutorial’s sandbox, with an Event loop is closed error while the machine was heavily loaded — just run phoenix serve again: the migrations are idempotent, and the second start picks up where the first left off.
Step 2: Trace your first agent call#
The fastest way to see a trace is the documented quickstart, pointed at Ollama instead of OpenAI. Two lines register Phoenix as the trace destination and switch on auto-instrumentation; every OpenAI SDK call after that produces a trace:
from phoenix.otel import register

register(
    project_name="phoenix-tutorial",
    protocol="http/protobuf",
    auto_instrument=True,
)

from openai import OpenAI

client = OpenAI(base_url="http://localhost:11434/v1", api_key="ollama")
resp = client.chat.completions.create(
    model="qwen3:0.6b",
    messages=[{"role": "user", "content": "Why did my invoice change?"}],
    max_tokens=512,
    temperature=0,
)
print(resp.choices[0].message.content)
print(resp.usage)
Two details matter. First, base_url is the whole trick: the OpenAI SDK talks to any OpenAI-compatible endpoint, and the OpenInference instrumentor traces the SDK calls, so it cannot tell — or care — that the model is a local Ollama model. Second, max_tokens=512: qwen3:0.6b is a thinking model that spends tokens reasoning before it answers, so a small cap can end the reply before the answer starts. (At max_tokens=128 the first run returned an empty answer; at 512 it answered in full.)
Verified output: the call returned a 310-token completion (16 prompt tokens, 326 total) and the trace appeared in Phoenix as a single ChatCompletion span of kind LLM, status OK, model qwen3:0.6b. You can read the same data back in code with the Phoenix client:
from phoenix.client import Client

px = Client()  # reads PHOENIX_ENDPOINT, default http://localhost:6006
df = px.spans.get_spans_dataframe(project_name="phoenix-tutorial", limit=10)
print(df[["name", "span_kind", "status_code",
          "attributes.llm.token_count.total",
          "attributes.llm.model_name"]].to_string())
Now the agent itself. The demo is a small support agent with three jobs: answer order questions by calling a lookup_order tool, answer policy questions from a tiny in-memory policy document, and write the final reply with the model. The router is deliberately deterministic — if the question contains an order number it takes the tool path, otherwise the retrieval path — so the demo is reproducible; the model still decides whether to call the tool and still writes every answer.
import json
import re
from phoenix.otel import register

register(project_name="phoenix-tutorial",
         protocol="http/protobuf", auto_instrument=True)

from openai import OpenAI
from opentelemetry import trace

tracer = trace.get_tracer(__name__)
client = OpenAI(base_url="http://localhost:11434/v1", api_key="ollama")
MODEL = "qwen3:0.6b"

POLICY_DOCS = {
    "basic-fare": (
        "Basic fares can be cancelled for a full refund within 48 hours of booking. "
        "Basic fares can be changed once for a 40 dollar fee, plus any price difference. "
        "Basic fares include one checked bag. A second bag is 45 dollars."
    ),
    "shipping": "Orders ship within 2 business days. Express shipping arrives in 1-2 days, "
                "standard shipping in 3-5 days.",
    "returns": "Returns are accepted within 30 days of delivery. "
               "Refunds go to the original payment method within 5 business days.",
}
ORDERS = {
    "7310": {"order_id": "7310", "status": "shipped", "total": 74.99,
             "carrier": "UPS", "eta": "Nov 21"},
    "9024": {"order_id": "9024", "status": "processing", "total": 129.50,
             "carrier": "FedEx", "eta": "Nov 24"},
    "1156": {"order_id": "1156", "status": "delivered", "total": 32.00,
             "carrier": "USPS", "eta": "Nov 15"},
}
The traced functions use the decorators that register() enables. After registration, trace.get_tracer(__name__) returns an OpenInference tracer with .agent, .chain, .retriever, and .tool decorators — each one creates a span of the matching kind and records the function’s input and output as span attributes:
@tracer.retriever
def retrieve_policy(question: str) -> str:
    """Keyword retrieval over the tiny policy KB. Returns the best doc."""
    words = set(re.findall(r"[a-z]+", question.lower()))
    best, best_score = "", -1
    for name, doc in POLICY_DOCS.items():
        score = len(words & set(re.findall(r"[a-z]+", doc.lower())))
        if score > best_score:
            best, best_score = doc, score
    return best


@tracer.tool
def lookup_order(order_id: str) -> dict:
    """Order lookup against the demo order table."""
    return ORDERS.get(order_id, {"error": f"order {order_id} not found"})


def _chat(messages, tools=None):
    import time
    from openai import InternalServerError
    last = None
    for attempt in range(3):
        try:
            return client.chat.completions.create(
                model=MODEL, messages=messages, tools=tools,
                max_tokens=256, temperature=0,
            )
        except InternalServerError as e:
            last = e
            print(f"[retry {attempt + 1}/3] Ollama 500: {e}", flush=True)
            time.sleep(15)
    raise last
The agent itself is one function under @tracer.agent. On the order path it hands the model the lookup_order tool definition, executes any tool call the model emits, and sends the result back for a final answer. On the policy path it injects the retrieved document into the system prompt:
TOOLS = [{
    "type": "function",
    "function": {
        "name": "lookup_order",
        "description": "Look up an order by its ID and return its status, total, carrier and ETA.",
        "parameters": {
            "type": "object",
            "properties": {"order_id": {"type": "string"}},
            "required": ["order_id"],
        },
    },
}]


@tracer.agent
def support_agent(question: str) -> str:
    system = (
        "You are a support agent. Answer using ONLY the context provided. "
        "If the context does not contain the answer, say you do not know."
    )
    order_match = re.search(r"\border\s+(\d{4})\b", question, re.IGNORECASE)
    if order_match:
        messages = [
            {"role": "system", "content": system},
            {"role": "user", "content": question},
        ]
        resp = _chat(messages, tools=TOOLS)
        msg = resp.choices[0].message
        if msg.tool_calls:
            for tc in msg.tool_calls:
                args = json.loads(tc.function.arguments)
                result = lookup_order(**args)
                messages.append(msg)
                messages.append({
                    "role": "tool",
                    "tool_call_id": tc.id,
                    "content": json.dumps(result),
                })
            resp = _chat(messages)
            return resp.choices[0].message.content or "(empty reply)"
        return msg.content or "(empty reply)"
    context = retrieve_policy(question)
    resp = _chat([
        {"role": "system", "content": system + f"\n\nContext:\n{context}"},
        {"role": "user", "content": question},
    ])
    return resp.choices[0].message.content or "(empty reply)"
Run it on three questions:
for q in [
    "Where is order 7310?",
    "How long do I have to cancel a Basic fare for a full refund?",
    "What does a second checked bag cost on a Basic fare?",
]:
    print("Q:", q)
    print("A:", support_agent(q))
Verified answers, all correct against the fixtures: order 7310 is shipped via UPS with delivery November 21; a Basic fare can be cancelled for a full refund within 48 hours of booking; a second checked bag costs 45 dollars. The order question took the tool path — the model emitted a lookup_order call with {"order_id": "7310"} and then wrote its answer from the result. The two policy questions took the retrieval path.
Step 3: Read the trace#
Open the phoenix-tutorial project in the UI and click a trace. What you get is a span tree, not a log line. Here is the order question’s trace, as Phoenix recorded it (latencies measured on the sandbox’s shared CPU, so treat them as shape, not benchmarks):
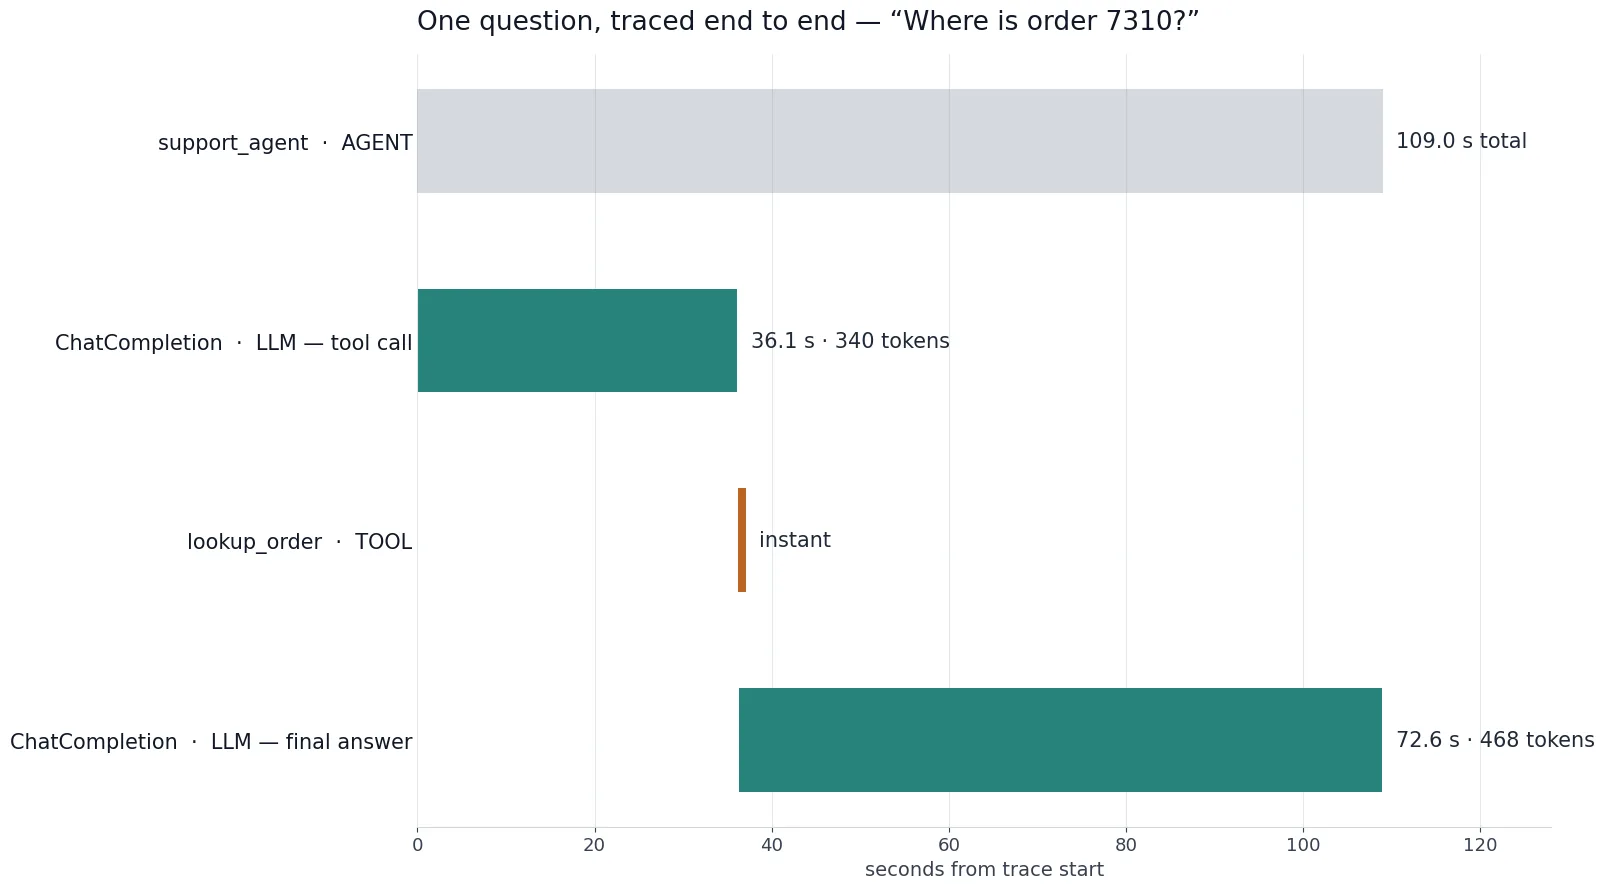
Four spans, and each one answers a different question:
| Span | Kind | Duration | What it tells you |
|---|---|---|---|
support_agent | AGENT | 109.0 s | The whole request, end to end |
ChatCompletion | LLM | 36.1 s · 340 tokens | The model’s first call — the one that emitted the tool call |
lookup_order | TOOL | < 0.001 s | The tool itself: instant, so it is never the bottleneck |
ChatCompletion | LLM | 72.6 s · 468 tokens | The final answer, written from the tool result |
Three things to notice. First, the shape is the diagnosis: if an agent is slow, the waterfall shows whether the time went to the model, the tools, or the retrieval — here it is all model time, and the tool is free. Second, each LLM span carries its full input and output: click it and you see the exact system prompt, the tool definition, the tool call’s arguments, and the raw response, including the model’s reasoning field — the thinking trace is preserved in the span, which is how you catch a model that reasoned correctly and then answered wrong. Third, the trace total (109.0 s) is the sum of its parts; there is no hidden overhead. On a quiet machine with a larger model these numbers shrink dramatically — the point is the shape, and the shape is what you debug.
The policy questions’ traces are simpler — agent, instant retriever, one LLM call — but the second one carries the most useful span in the whole tutorial. Its first model call died: the local model runner was killed mid-generation, and Phoenix recorded it as an ERROR span lasting 181.0 s with no tokens and no output. The retry then succeeded in 102.7 s with 275 tokens. Without the trace, that failure looks like “the agent was slow”; with it, you can see it was a dead model call, how long it burned, and that the retry is what saved the request. Traces are how you tell a slow model from a broken one.
Across the whole session Phoenix recorded 19 spans in 7 traces, including two from the bare quickstart call (144 and 326 tokens). The full inventory is in the verification notes; the pattern to remember is that every call — good, slow, or failed — leaves a span.
Step 4: Score it — the judge and the code check#
A trace shows what happened. It does not say whether the answer was any good. That is what evaluators are for, and Phoenix runs two kinds side by side: an LLM-as-judge classifier for open-ended quality, and a deterministic code check for facts you can test exactly.
The judge follows the Evaluate quickstart. You describe the scoring rule in plain language, give it the labels it may return, and point it at a model — here the same local model, via the OpenAI-compatible endpoint. The LLM wrapper forwards extra keyword arguments to the SDK client constructors, so base_url and api_key route the judge to Ollama exactly like the agent’s calls:
from phoenix.evals import LLM, bind_evaluator, create_classifier

judge = create_classifier(
    name="correctness",
    llm=LLM(
        provider="openai",
        model="qwen3:0.6b",
        base_url="http://localhost:11434/v1",
        api_key="ollama",
    ),
    prompt_template="""Compare the provided answer to the reference answer.
Label true if it states the same policy: same time windows, fees, and quantities, in any wording.
Label false if it contradicts the reference, hedges, or leaves out a fee, limit, or condition.

Reference answer: {{reference}}
Provided answer: {{output}}""",
    choices={"true": 1.0, "false": 0.0},
)

correctness = bind_evaluator(
    evaluator=judge, input_mapping={"reference": "reference.expected_answer"}
)
The code check is a plain function turned into an evaluator with create_evaluator. It answers one question — does the reply contain the fact the example requires? — and it cannot be fooled by fluent wording:
from phoenix.evals import create_evaluator

@create_evaluator(name="contains_fact")
def contains_fact(output, expected) -> bool:
    """Deterministic check: does the answer contain the example's key fact?"""
    fact = (expected or {}).get("key_fact", "")
    return fact.lower() in str(output).lower()
Run both on every result. The judge catches paraphrase and partial credit that a substring check misses; the code check catches the judge being generous or confused. When they disagree, trust the code check and go read the trace — that disagreement is itself a finding.
Step 5: Datasets and experiments — prove the fix#
One scored answer is an anecdote. A dataset turns it into evidence. Create a dataset of the questions your agent must get right, each with the reference answer and the key fact:
from phoenix.client import Client

phoenix = Client()

dataset = phoenix.datasets.create_dataset(
    name="support-policy",
    examples=[
        {"input": {"question": "How long do I have to cancel a Basic fare for a full refund?"},
         "output": {"expected_answer": "Basic fares can be cancelled for a full refund within 48 hours of booking.",
                    "key_fact": "48 hours"}},
        {"input": {"question": "Can I change the date on a Basic fare, and what does it cost?"},
         "output": {"expected_answer": "Basic fares can be changed once for a 40 dollar fee, plus any price difference.",
                    "key_fact": "40 dollar"}},
        {"input": {"question": "How many checked bags come with a Basic fare, and what does a second bag cost?"},
         "output": {"expected_answer": "Basic fares include one checked bag. A second bag is 45 dollars.",
                    "key_fact": "45 dollars"}},
        {"input": {"question": "How long do returns take to refund?"},
         "output": {"expected_answer": "Refunds go to the original payment method within 5 business days.",
                    "key_fact": "5 business days"}},
    ],
)
Then run the same task under two prompts as experiments. The baseline answers with no policy context; the second retrieves the policy document first — the same two prompts from Step 2, now measured instead of argued about:
def make_task(with_policy: bool):
    def task(input):
        question = input["question"]
        if with_policy:
            context = retrieve_policy(question)
            system = ("You are a support agent. Answer using ONLY the context provided. "
                      "If the context does not contain the answer, say you do not know."
                      f"\n\nContext:\n{context}")
        else:
            system = "You are a support agent. Answer the customer's question."
        resp = _chat([
            {"role": "system", "content": system},
            {"role": "user", "content": question},
        ])
        return resp.choices[0].message.content or ""
    return task

base = phoenix.experiments.run_experiment(
    dataset=dataset, task=make_task(False),
    evaluators=[correctness, contains_fact],
    experiment_name="baseline", timeout=600,
)
pol = phoenix.experiments.run_experiment(
    dataset=dataset, task=make_task(True),
    evaluators=[correctness, contains_fact],
    experiment_name="with-policy", timeout=600,
)
Two practical notes. First, the timeout: the default is 60 seconds per task, and a local 0.6B model on a shared CPU needs more — 600 seconds keeps slow generations from being re-queued as timeouts. Second, each experiment gets a compare view in the UI (/datasets/<id>/compare?experimentId=…), so the two runs sit side by side with their scores.
Measured results, four examples each:
| Question | Baseline (judge / fact) | With policy (judge / fact) |
|---|---|---|
| Cancel Basic fare — full refund window? | 0.0 / 0.0 | 1.0 / 1.0 |
| Change Basic fare — cost? | 0.0 / 0.0 | 1.0 / 1.0 |
| Second checked bag — cost? | 0.0 / 0.0 | 1.0 / 1.0 |
| Returns — refund time? | 0.0 / 0.0 | 0.0 / 1.0 |
Retrieval changed everything — and the judge nearly missed it. The baseline scored 0 out of 4 on both evaluators: three answers came back empty (the thinking model spent its 256-token budget thinking and hit the length limit before writing anything) and the fourth hallucinated a returns policy. With the policy document in the prompt, the fact check went to 4 out of 4 — every answer stated the right fee, window, or quantity. The judge agreed on three of the four, but called the refunds answer false: it confused the 30-day returns window with the 5-business-day refund window, even though both are correct and both come straight from the policy. Two of the judge's calls also died outright when the local model runner was killed mid-generation (unexpected EOF) and had to be re-run. That is the point of running two evaluators: the code check is the ground truth for facts, and the judge is a second opinion you verify, not a verdict you trust blindly.
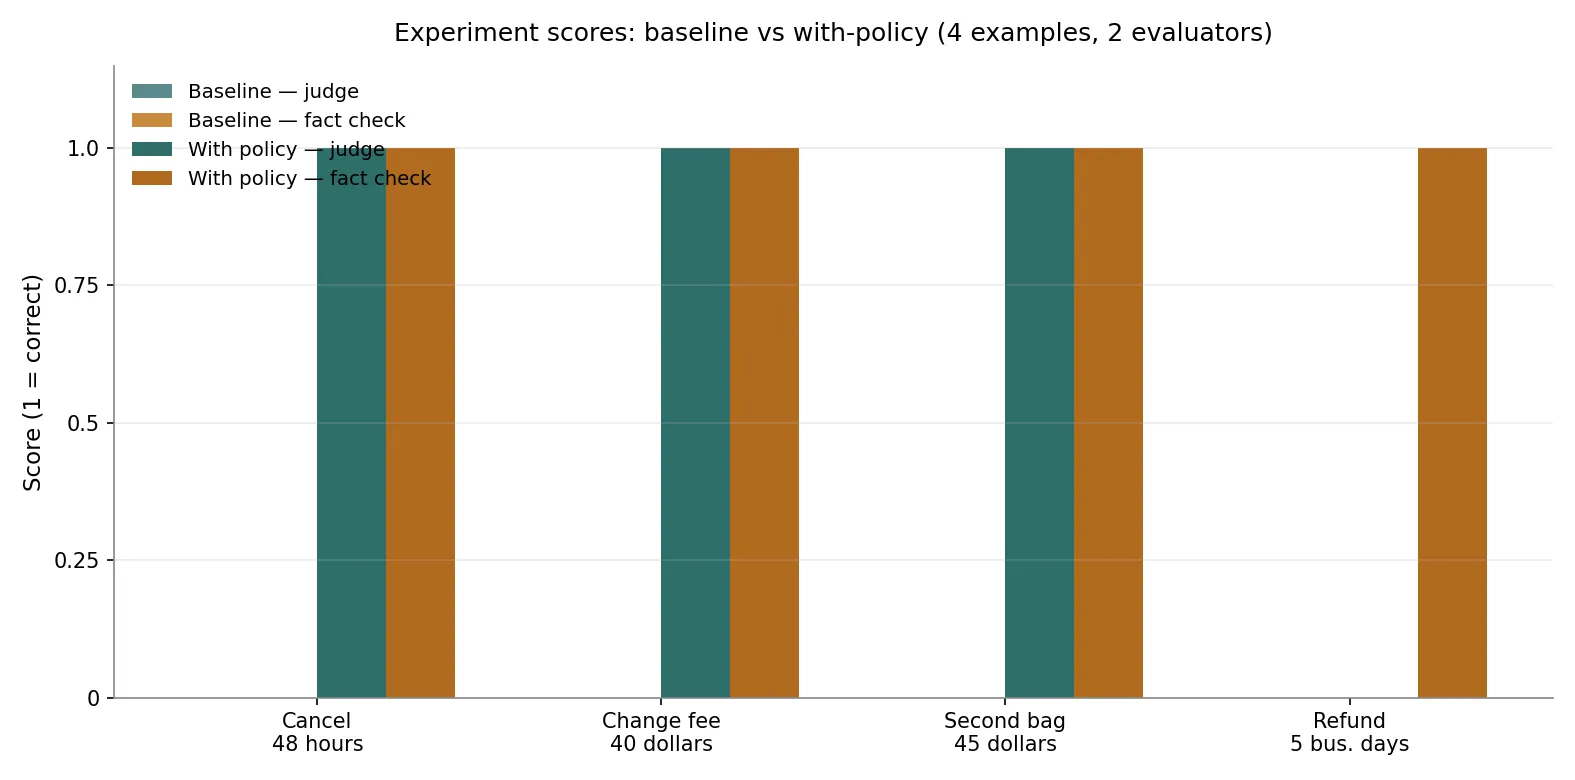
The lesson is not that retrieval is magic — it is that the experiment makes the claim checkable. The baseline’s failures are visible in the traces: the model guessing a policy it was never given. The with-policy run’s traces show the retrieved document in the system prompt and the answer quoting it. If you change the prompt, the retriever, or the model, you re-run the same dataset and the numbers tell you whether you helped or hurt — that is the whole point of the loop.
Step 6: Make it a habit#
Three things turn this from a demo into practice.
Trace in production the same way. The instrumentation does not change between local and deployed: register() points at whatever Phoenix you run, via the PHOENIX_COLLECTOR_ENDPOINT environment variable, and auto_instrument=True picks up every installed OpenInference package. For a deployed service, switch the span processor: register() uses a SimpleSpanProcessor by default and warns you to use a BatchSpanProcessor in production, which buffers spans instead of exporting each one synchronously.
Group turns into sessions. Real users have conversations, and a per-turn trace cannot show whether the agent remembered the order ID from three turns ago. Phoenix groups turns into sessions; annotate the session with the outcome (resolved, escalated, abandoned) and you can measure whole conversations, not just single answers.
Annotate what the evals miss. The UI lets you attach human feedback directly to a trace — a thumbs up or down, a corrected answer, a note. Those annotations become the next dataset: the failures you found in production, turned into regression tests. That is the loop the tracing tutorial’s second chapter is built around, and it is the cheapest eval data you will ever collect.
Which approach should you use?#
Phoenix is not the only observability option. Pick by where your app lives and how much you want to operate:
| Option | Best for | Cost | Watch out for |
|---|---|---|---|
| Arize Phoenix (local) | Local development, self-hosted teams, anyone who wants traces without an account | Free, open source | You operate the server and its SQLite/Postgres store |
| Arize AX | Teams that want Phoenix’s workflow as a managed platform | Paid, managed | Same open standards underneath, so traces port over |
| Langfuse / LangSmith | Teams already invested in those ecosystems, or who want hosted evals and prompt management first | Free tiers, then paid | Different data models — pick one observability home, not three |
| Plain logging | Throwaway scripts | Free | No span trees, no token accounting, no evals — you will rebuild Phoenix badly |
The deciding factor is the standard underneath. Phoenix is built on OpenTelemetry and OpenInference, and the auto-instrumentation covers OpenAI, Anthropic, Bedrock, LangChain, LlamaIndex, DSPy, Mastra, and the Vercel AI SDK. If you ever switch providers or frameworks, the traces keep working — the instrumentation is not tied to one vendor’s SDK.
The takeaway#
- Start Phoenix first, then build the agent.
phoenix servetakes a minute; the traces it captures will save you hours of guessing. - Two lines instrument everything.
register()withauto_instrument=Truetraces every OpenAI-compatible call, local or hosted. - Wrap your own code with the OpenInference decorators.
@tracer.agent,.retriever, and.toolturn your functions into spans with inputs and outputs attached. - Read the waterfall before you optimize. The span tree shows whether the time went to the model, the tools, or the retrieval — and failed calls show up as ERROR spans with their durations.
- Score with two evaluators. An LLM judge for quality, a code check for facts. Trust the code check when they disagree.
- Prove changes with experiments. Same dataset, two prompts, one scoreboard. Re-run it every time you touch the prompt, the retriever, or the model.
Agents fail in ways that logs cannot see: a wrong retrieval, a tool call with a hallucinated argument, a correct line of reasoning followed by a wrong answer. A trace shows all three in one place, an eval scores them, and an experiment proves the fix. That loop — trace, measure, improve — is the difference between shipping an agent and operating one.
Sources#
- Arize Phoenix — What is Phoenix?
- Arize Phoenix — Start Phoenix
- Arize Phoenix — Observe (tracing quickstart)
- Arize Phoenix — Evaluate (datasets and experiments quickstart)
- Arize Phoenix — Tracing Tutorial
- Arize Phoenix on GitHub
- OpenInference on GitHub
- Ollama
- AI Frontier Post — Testing agents: task-based evals for tool-using models
Frequently asked questions
Do I need an API key to run this tutorial?
No. Phoenix runs on your machine and the model runs on your machine through Ollama, so there is no key, no account, and no cost. The LLM judge in Step 4 also runs on the local model — the LLM wrapper just needs the Ollama endpoint as its base_url.
Why did the baseline experiment return empty answers?
The 0.6B model is a thinking model: it reasons before it answers, and the reasoning counts against the 256-token limit. Without policy context it spent the whole budget thinking and hit the length limit (finish_reason “length”) before writing anything — the span shows 256 completion tokens and an empty answer. With the policy in the prompt, the reasoning is short and the answer fits. Raise max_tokens or use a larger model if you need longer answers from a bare prompt.
Can I use Phoenix with a hosted model instead of Ollama?
Yes. The instrumentation is the same: register() with auto_instrument=True traces any OpenAI-compatible call, including calls to a hosted API. Point PHOENIX_COLLECTOR_ENDPOINT at a remote Phoenix if the server is not local, and give the judge LLM() the hosted model's base_url and key.
What do I do when the judge and the code check disagree?
Trust the code check and go read the trace. The code check tests one exact fact; the judge tests open-ended quality. When they disagree, either the judge was generous with a wrong answer or the code check missed a valid paraphrase — both are findings, and the trace shows which.
Where do the experiment traces go?
run_experiment traces each task run into its own auto-named project in the Phoenix UI (Experiment-…), separate from your app's project. The dataset's experiments page lists every run with its scores, and the compare view puts two experiments side by side.