Charts your coding agent can actually draw: hands-on with Microsoft Flint 1.0
Ask your coding agent for a chart and it will happily comply. What you get back is usually a chart-shaped disappointment: a bar chart for a time series, a pie chart with eleven slices, axis labels that overlap into mush. Microsoft’s Flint 1.0 is a visualization language built for agents — one semantic spec compiles to five backends — and this guide wires its MCP server into your agent and renders a first chart from real data.
- What: Microsoft Flint 1.0: a visualization language that lets AI agents create charts from one semantic spec (
ChartAssemblyInput), rendered through an MCP server, an npm library, or a CLI. - Versions:
flint-chart1.0.1 andflint-chart-mcp1.0.1 (npm, November 8, 2026). Node.js 18 or later; this guide used Node v24.22.1. - Verified: November 8, 2026: the MCP server driven over stdio with a scripted JSON-RPC client (initialize, all nine tools, SVG and PNG renders), the library compile to Vega-Lite and ECharts, the CLI compile to SVG and PNG, and the theme and interaction presets. Host steps (Claude Code, Claude Desktop, Cursor) follow the server’s own README; the server they attach to is the one proven here.
- Requirement: Node.js 18+ and about 30 minutes. No API key, no account, no model bill. An MCP client is optional, for Step 2 only.

Ask your coding agent for a chart and it will happily comply. What you get back is usually a chart-shaped disappointment: a bar chart for a time series, a pie chart with eleven slices, axis labels that overlap into mush, a legend that explains nothing. The model knows the charting library's syntax. It does not know which chart to draw, how to lay it out, or when the thing it just produced is wrong.
Microsoft's Flint is a visualization language built for exactly this gap. Instead of asking the model to emit raw Vega-Lite or ECharts JSON — a large, fiddly schema it will get subtly wrong — you give it one small semantic spec: the data, what each field means, the chart type, a theme, and an interaction. Flint's compiler resolves the rest: scales, axes, formatting, colors, layout. The same spec renders on five backends — Vega-Lite, ECharts, Chart.js, Plotly, and native Excel charts — and ships as an MCP server your agent can call directly.
Flint 1.0 landed on October 19, 2026. This guide wires its MCP server into your agent, renders a first chart from real data, validates the spec the way the server does, and compiles the same spec three ways — library, CLI, and MCP — with every step run on this machine on November 8, 2026. No API key, no account, no model bill: the server renders locally, in process, and your data never leaves your machine.
What you'll need#
- Node.js 18 or later and npm. This guide used Node v24.22.1 and npm 10.9.4. Check yours with
node --version. - A text editor and a terminal. About 30 minutes.
- An MCP client for Step 2 — Claude Code, Claude Desktop, Cursor, or VS Code. Optional: everything else in this guide runs without an agent, through the same protocol, so you can verify the server before you hand it to one.
- Nothing else. No API key, no account, no paid model. Flint is MIT-licensed, and the MCP server's rendering runs locally in process.
Step 1: Run the MCP server and prove it answers#
Flint ships two npm packages: flint-chart (the library) and flint-chart-mcp (the MCP server). Both are at version 1.0.1. Start with the server — it needs no install:
npx -y flint-chart-mcpThe server starts on stdio and says so on stderr:
flint-chart-mcp 1.0.1 ready on stdio (backends: vegalite, echarts, chartjs; local files readable on request)Before trusting any MCP server, make it answer a question with no agent in the loop. The MCP protocol over stdio is newline-delimited JSON-RPC, so a short script can drive it directly. Send initialize:
{"jsonrpc": "2.0", "id": 1, "method": "initialize",
 "params": {"protocolVersion": "2025-06-18", "capabilities": {},
            "clientInfo": {"name": "probe", "version": "1.0.0"}}}
The server answers with its identity and its instructions:
{"result": {"protocolVersion": "2025-06-18",
  "serverInfo": {"name": "flint-chart-mcp", "version": "1.0.1"},
  "instructions": "Flint compiles one semantic chart spec (ChartAssemblyInput) into Vega-Lite, ECharts, or Chart.js..."}}
Then list the tools. There are nine:
render_chart, compile_chart, validate_chart, list_chart_types,
list_interaction_presets, get_flint_skill, list_themes, validate_board, show
That list is the whole surface, and it is deliberately small. Most chart MCP servers expose one tool per chart type — 26 or more — because every chart has a different schema. Flint has one schema (ChartAssemblyInput) spanning its chart types, so the server exposes a handful of tools that all take the same spec. show opens a live chart card in hosts with MCP App UIs (Claude Desktop); render_chart is the fallback that returns a static PNG or SVG. The server keeps nothing between calls — every tool rebuilds the chart from the spec it is given — and it renders locally, so the rows you pass never leave your machine.
Step 2: Wire it into your agent#
Registration is the standard MCP client config. In Claude Code, Claude Desktop, Cursor, or VS Code, add a server named flint:
{
  "mcpServers": {
    "flint": {
      "command": "npx",
      "args": ["-y", "flint-chart-mcp"]
    }
  }
}
In Claude Code the same registration is one command:
claude mcp add flint -- npx -y flint-chart-mcpRestart the client, then ask it something that forces a tool call rather than a guess: List Flint's chart types for the Vega-Lite backend.
The server returns a 28,350-character catalog — 39 chart types on Vega-Lite alone, each with its encoding channels and the interaction presets it supports. If the agent answers from memory instead, it has not picked up the server; the tools-list probe in Step 1 is the ground truth that the server works, and a fresh client restart is the usual fix.
Two options worth knowing before you hand the server to an agent. By default the server can read any local file your agent references in data.url — a relative path resolves against the working directory, an absolute path is read as given, and remote URLs are never fetched. For an untrusted deployment, pass --disable-file-reference and it accepts only inline data.values. And you can gate the exposed backends at deploy time with FLINT_MCP_BACKENDS=vegalite,echarts npx -y flint-chart-mcp.
Step 3: Write your first spec#
Every Flint chart is one JSON object with four parts: the data, the semantic types, the chart spec, and optional theme and interaction specs. Here is the one this guide renders, saved as chart.json. The data is real: GitHub star counts, in thousands, for the most-starred AI repositories in the November 6, 2026 GitHub AI Radar report (Caveman's count cross-checked against its repository page, 118,194 stars).
{
  "data": {"values": [
    {"Repo": "ECC", "Stars": 298.3},
    {"Repo": "hermes-agent", "Stars": 261.1},
    {"Repo": "firecrawl", "Stars": 199.2},
    {"Repo": "ComfyUI", "Stars": 145.4},
    {"Repo": "graphify", "Stars": 143.4},
    {"Repo": "MoneyPrinterTurbo", "Stars": 140.1},
    {"Repo": "caveman", "Stars": 118.2},
    {"Repo": "claude-mem", "Stars": 113.8}
  ]},
  "semantic_types": {"Repo": "Category", "Stars": "Quantity"},
  "chart_spec": {
    "chartType": "Bar Chart",
    "encodings": {"x": "Stars", "y": "Repo"}
  },
  "theme_spec": "economist",
  "interaction_spec": {"interactions": [{"type": "click-highlight"}]}
}
Read it field by field, because this is the whole mental model:
data.values— the rows, inline. You can also point at a local.json,.csv, or.tsvfile withdata.url; the server never fetches remote URLs.semantic_types— what each field means.Repois aCategory,Starsis aQuantity. There are 44 registered semantic types (YearMonth,Temperature,Delta,Rank, and more), and the compiler uses them to infer parsing, scales, axes, formatting, and colors. This is the part the model usually gets wrong when it writes raw chart JSON — and the part Flint makes explicit.chart_spec— the chart type (Bar Chart) and the encodings (xis Stars,yis Repo). The compiler adapts sizing, spacing, labels, and legends to the data; the same spec renders across backends.theme_spec—economist, one of 14 preset themes. Geometry, typography, and color are reusable specs that apply across chart types; you can extend a preset and override only your brand color (Step 7).interaction_spec—click-highlight: click a bar to emphasize it and mute the rest. One of 23 interaction presets — but not every preset fits every chart, which is what Step 4 is for.

The point of the exercise is the direction of the work. Without Flint, your agent writes a 200-line Vega-Lite spec and you debug it. With Flint, your agent writes a 20-line semantic spec and the compiler does the 200 lines — deterministically, the same way every time.
Step 4: Validate before you render#
Flint's most useful habit is one most chart tools skip: it validates the spec and tells you what is wrong before anything is drawn. Call validate_chart with the spec's fields and the backend:
{"jsonrpc": "2.0", "id": 5, "method": "tools/call",
 "params": {"name": "validate_chart",
            "arguments": {"data": {"values": [...]}, "semantic_types": {"Repo": "Category", "Stars": "Quantity"},
                          "chart_spec": {"chartType": "Bar Chart", "encodings": {"x": "Stars", "y": "Repo"}},
                          "theme_spec": "economist",
                          "interaction_spec": {"interactions": [{"type": "click-highlight"}]},
                          "backend": "vegalite"}}}
Note the shape: the tool takes the spec's fields spread at the top level of arguments — data, chart_spec, theme_spec — not nested under a spec key. Passing a nested spec object fails with MCP error -32602: Required at data, Required at chart_spec, which is the mistake I made on the first attempt. The response, when the shape is right:
{"backend": "vegalite", "chartType": "Bar Chart", "valid": true,
 "warnings": [], "errors": [],
 "computedSize": {"width": 395, "height": 272}}
Valid, no warnings, and the compiler even tells you the size it computed. The validator also catches the kind of mistake that silently produces a bad chart. My first draft of this spec used inspect-index — hover to read values at an index — as the interaction. The validator returned valid: true but with a warning:
Interaction "inspect-index" requires an index axis shared by the series;
Bar Chart has none. The interaction was dropped.
That is the guardrail working: inspect-index belongs on line and area charts, where an index axis exists. A bar chart's supported interactions are a different set — click-highlight, axis-highlight, select, lasso-select, brush-x, and 16 more, 21 in total — which is exactly what list_chart_types reports per chart type. Swapping in click-highlight cleared the warning. Treat the validator as the spec's linter: run it first, read the warnings, and only then render.
Step 5: Render it#
With a clean validation, render. render_chart takes the same arguments plus a format:
{"jsonrpc": "2.0", "id": 7, "method": "tools/call",
 "params": {"name": "render_chart",
            "arguments": {"data": {"values": [...]}, "semantic_types": {"Repo": "Category", "Stars": "Quantity"},
                          "chart_spec": {"chartType": "Bar Chart", "encodings": {"x": "Stars", "y": "Repo"}},
                          "theme_spec": "economist",
                          "interaction_spec": {"interactions": [{"type": "click-highlight"}]},
                          "backend": "vegalite", "format": "svg"}}}
The SVG came back as 10,418 characters of self-contained markup, 522 by 349 pixels. Asking for format: "png" instead returned a 17,555-byte PNG with valid PNG magic bytes. Both renders happened in process, on this machine, with no network call. This is the SVG the server produced from the spec in Step 3 — the actual artifact, not a mockup:
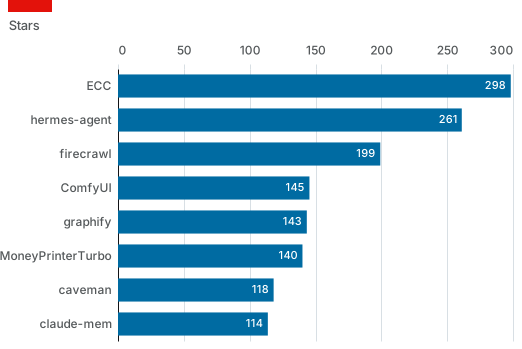
Eight bars, values printed on the marks, the Economist theme's typography and grid. The chart is not beautiful by accident — the theme decided the fonts (Helvetica Neue), the grid color, and the label placement. Change one string in the spec and the whole look changes; that is Step 7.
Step 6: Compile the same spec three ways — no agent needed#
The MCP server is the convenient path, but the compiler underneath is a plain npm library, and it also ships as a CLI. All three take the same chart.json. Use the library when you are building an app; the CLI when you want a file; the MCP server when you want an agent to do it.
The library. Install it and compile in Node:
npm install flint-chartimport { assembleVegaLite } from 'flint-chart/vegalite';
import { assembleECharts } from 'flint-chart/echarts';
import { validateChart } from 'flint-chart/validate';
import { readFileSync } from 'node:fs';
const spec = JSON.parse(readFileSync('chart.json', 'utf8'));
console.log(validateChart(spec, 'vegalite'));
// { backend: 'vegalite', chartType: 'Bar Chart', valid: true,
// warnings: [], errors: [], computedSize: { width: 395, height: 272 } }
const vl = assembleVegaLite(spec); // a layered Vega-Lite spec, 8 data values
const ec = assembleECharts(spec); // an ECharts option: series[0].type === 'bar'The Vega-Lite output is a layered spec carrying the Economist theme in its config — fonts, grid colors, label sizes — and the ECharts output is a ready-to-mount option object with a bar series and a value x-axis. One spec, two backends, one function call apart. The package also exports assembleChartjs, assemblePlotly, and assembleExcel for the other backends, plus listThemePresets() (14 themes) and listInteractionPresets() (23 presets) for discovery.
The CLI. The MCP package also installs a flint-chart command that compiles a saved spec to an image with no agent and no code:
flint-chart compile chart.json --format svg
flint-chart compile chart.json --backend echarts --format png --output chart.png
cat chart.json | flint-chart compile - --format svg > chart.svg
The first command reports Wrote vegalite · svg · 522×349px → chart.svg and writes a 10,418-byte SVG — the same bytes the MCP server returned. But there is a catch, and it cost me twenty minutes: in version 1.0.1, the documented command silently does nothing when run through npx or npm's .bin symlink. It exits 0, prints nothing, and writes no file. The cause is in the CLI's entry check in dist/flint-chart.js: it compares the invoked path against its own real path, and the symlink npm creates does not resolve to it, so main() never runs. The workaround is to invoke the real file directly:
node ./node_modules/flint-chart-mcp/dist/flint-chart.js compile chart.json --format svg --output chart.svgThat is the one genuine bug I hit in this guide, and it only affects the CLI binary — the MCP server works exactly as documented through npx (Step 1 proved it). If you run the documented command and nothing happens, this is why; use the real path until a fixed release lands. The Chart.js backend, note, renders PNG only — asking it for SVG fails, because its engine has no SVG output.
Step 7: Themes and interactions#
With the pipeline working, the fun part is cheap: change strings, not code. list_themes returns the 14 shipped presets:
nyt, economist, swiss, nature, mckinsey, datawrapper, powerbi,
powerbi-light, pop, cartoon, apple, de-stijl, bbc, material
Swap theme_spec to nyt and re-validate — it validates clean — and the same eight bars come back in New York Times style: a headline that states the finding, values printed on the marks, series named at their own ends. A brand adjustment is an extension, not a rewrite:
{
  "theme_spec": {
    "extends": "economist",
    "id": "our-brand",
    "ink": { "series": { "single": "#6b3fa0" } }
  }
}
That spec — extending economist with a single purple series color — also validates clean and assembles to the same eight values. Keep the override small; the preset does the rest.
Interactions work the same way, with one rule: the preset has to fit the chart. list_interaction_presets returns all 23, each with what it does, what it needs from the chart, and the options it accepts. On this bar chart, click-highlight and brush-x (drag an interval along the x-axis to select a range of star counts) both fit; inspect-index does not, and the validator says so instead of silently drawing nothing. For a line chart with a time axis, inspect-index is the right call — hover to read values at each month. When a chart needs more than one view, validate_board checks a whole dashboard of charts — headline, layout, and the links between them — without drawing anything.
Which approach should you use?#
| Path | Use it when | What you get |
|---|---|---|
| MCP server | You live in an agent chat and want charts on demand | Nine tools; the agent authors, validates, and renders the spec. show opens a live card in MCP App hosts. |
Library (flint-chart) | You are building an app or dashboard | assembleVegaLite / assembleECharts / assemblePlotly / assembleChartjs / assembleExcel — one spec, five backends, plus React and vanilla JS embedding. |
CLI (flint-chart compile) | You want a file, no agent and no code | SVG or PNG from a saved spec JSON. Mind the 1.0.1 symlink bug in Step 6. |
| Excel backend | The chart belongs in a report or spreadsheet | assembleExcel produces a native, editable Excel chart spec. Rendering it needs an Office.js host, so no .xlsx was produced in this guide. |
If you only do one of these, do the MCP server. It is the path where Flint's design pays off most: the agent stops writing chart-library JSON it half-remembers, and starts writing a twenty-line semantic spec the compiler can check.
Troubleshooting: the failures you will actually hit#
- The CLI exits 0 and writes nothing. You ran it through npx or
node_modules/.bin— the 1.0.1 symlink bug from Step 6. Invoke the real file withnodeand the path. MCP error -32602: Required at data, Required at chart_spec. You nested the spec under aspeckey. The tools take the spec's fields spread at the top level ofarguments.- A warning says an interaction was dropped. Read it — it names the preset and the reason, usually that the chart type has no axis the preset needs. Check
list_chart_typesfor the presets your chart type actually supports. - Chart.js refuses SVG. By design: that backend renders PNG only. Ask for
format: "png". - The agent answers from memory instead of calling the tools. Restart the client after adding the server, and ask for something only the tools can answer —
list Flint's chart types
orwhat themes ship with Flint?
- Your CSV is not being read.
data.urlaccepts local files only; remote URLs are never fetched. Pass the rows inline withdata.values, or point at a local file.
The takeaway#
Agents are going to draw most of the charts from now on — in notebooks, in dashboards, in chat. The question is whether the chart they draw is a guess in a big schema or a checked spec in a small one. Flint 1.0 makes it the second: one semantic spec, a compiler that resolves the details, a validator that catches the mismatches, and five backends that all agree on what the chart is. Wire the MCP server into your agent, keep validate_chart in the loop, and the charts stop being the part of the agent's output you quietly fix by hand.
Frequently asked questions
Do I need an API key or an account to use Flint?
No. Both packages are free and MIT-licensed, and the MCP server renders locally in process. Your data goes from your machine to the rendering code on your machine — nothing is uploaded.
Which charting backends does one spec support?
Five: Vega-Lite, ECharts, Chart.js, Plotly, and native Excel charts. The MCP server exposes three of them (Vega-Lite, ECharts, Chart.js); the library adds Plotly and Excel. The project reports 52 chart types across the five backends; the Vega-Lite backend lists 39.
Can Flint read my spreadsheet or CSV?
Yes, as a local file: pass data.url pointing at a .json, .csv, or .tsv file, or paste the rows inline as data.values. Remote URLs are never fetched. Pass --disable-file-reference to the server to reject file references entirely.
Why did the CLI do nothing when I ran it?
Version 1.0.1 has a bug: run through npx or npm's .bin symlink, the flint-chart CLI exits 0 without running, because its entry check compares the invoked path against its real path. Run the real file directly with node ./node_modules/flint-chart-mcp/dist/flint-chart.js compile …. The MCP server is unaffected.
Does Flint replace Vega-Lite or ECharts?
No — it compiles to them. Flint is the authoring layer: you write the semantic spec, and the compiler produces the backend-native spec. If you already have Vega-Lite or ECharts code, Flint is a way to let an agent generate it reliably rather than a replacement for it.
Sources
- microsoft/flint-chart — GitHub repository — README: Flint 1.0 (October 19, 2026), 52 chart types across 5 backends, 14 themes, 23 interaction presets, npm library and MCP server; read November 8, 2026.
- flint-chart-mcp README — nine tools, MCP client config,
--disable-file-reference,FLINT_MCP_BACKENDS, CLI usage and options; read November 8, 2026. - npm: flint-chart — version 1.0.1; read via the npm registry November 8, 2026.
- npm: flint-chart-mcp — version 1.0.1; read via the npm registry November 8, 2026.
- Flint project site — gallery, live editor, theme explorer, interaction gallery; read November 8, 2026.
- GitHub AI Repo Trending Report, November 6, 2026 — star counts used for the example chart; read November 8, 2026.