Give your coding agent real eyes: hands-on with Chrome DevTools MCP
Chrome DevTools MCP (ChromeDevTools/chrome-devtools-mcp, 53,000+ stars, Apache-2.0) hands your coding agent the keys to a live Chrome browser — screenshots, console messages, network requests, performance traces, and Lighthouse audits. Install it with one command, then let your agent see what it builds.
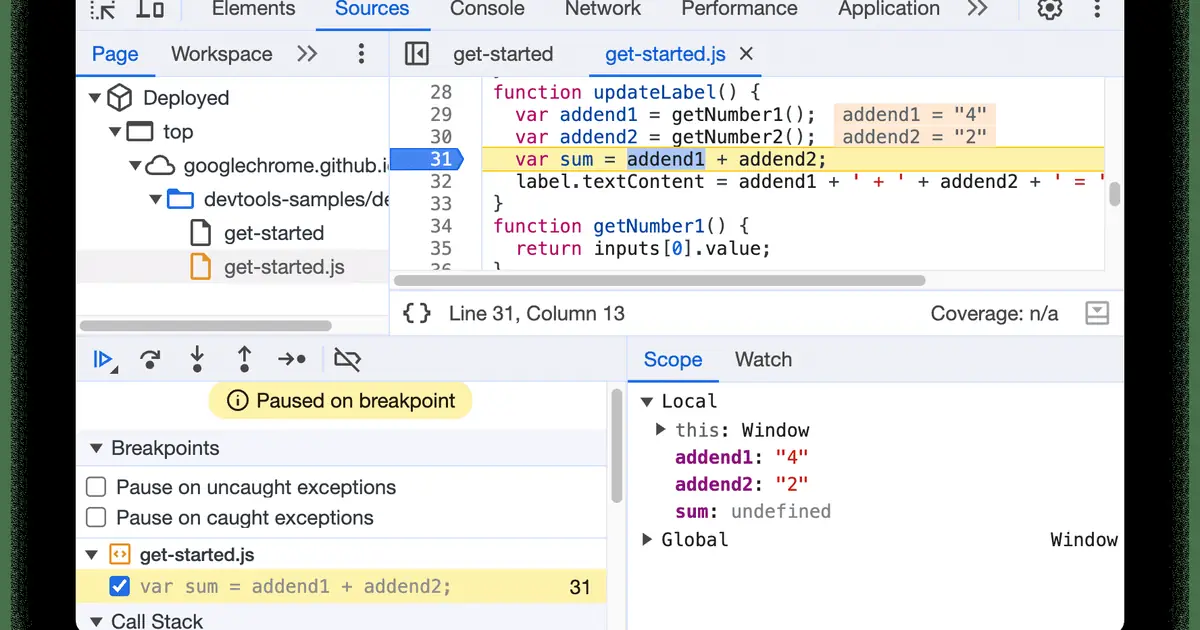
Your coding agent writes code blind. It generates a page it has never seen, wires up a form it has never clicked, and declares victory without once looking at the result. You run the thing, spot the broken layout yourself, and paste the error back into the chat like a human screenshot-to-text converter.
Chrome DevTools MCP closes that loop. It is an official MCP server from the Chrome DevTools team (ChromeDevTools/chrome-devtools-mcp, 53,000+ stars, Apache-2.0) that hands your coding agent — Claude Code, Cursor, Copilot, Antigravity, Gemini CLI — the keys to a live Chrome browser: screenshots, console messages, network requests, performance traces, even Lighthouse audits. The agent stops guessing and starts looking. Every command below comes from the project's own README and docs.
What you'll need
- Node.js LTS and npm — check with
node -v - Google Chrome, current stable (Chrome for Testing works too — other Chromium browsers are not officially supported)
- Claude Code already working in your terminal — the same server config also works in Cursor, Copilot, Antigravity, and VS Code
1. Install the MCP server
One command registers the server with Claude Code, scoped to your user so it is available in every project:
claude mcp add chrome-devtools --scope user npx chrome-devtools-mcp@latestRestart Claude Code (or reload your MCP configuration). One thing worth knowing from the README: the server launches Chrome lazily — merely connecting to the MCP server does not start a browser. Chrome only opens when the agent actually calls a tool that needs it.
2. Give it eyes: the first prompt
The project's own smoke test is one sentence. Type it into Claude Code and watch:
Check the performance of https://developers.chrome.comChrome opens, records a performance trace (performance_start_trace / performance_stop_trace under the hood), and the agent reports back actionable insights — not raw numbers, but what to fix. If you see a browser window open and a trace summary come back, the wiring works.
3. Point it at your own work
This is where it gets useful. Start your local dev server, then hand the agent a real debugging task:
Open http://localhost:3000, take a screenshot of the homepage, and tell me
what console errors and failed network requests you see.
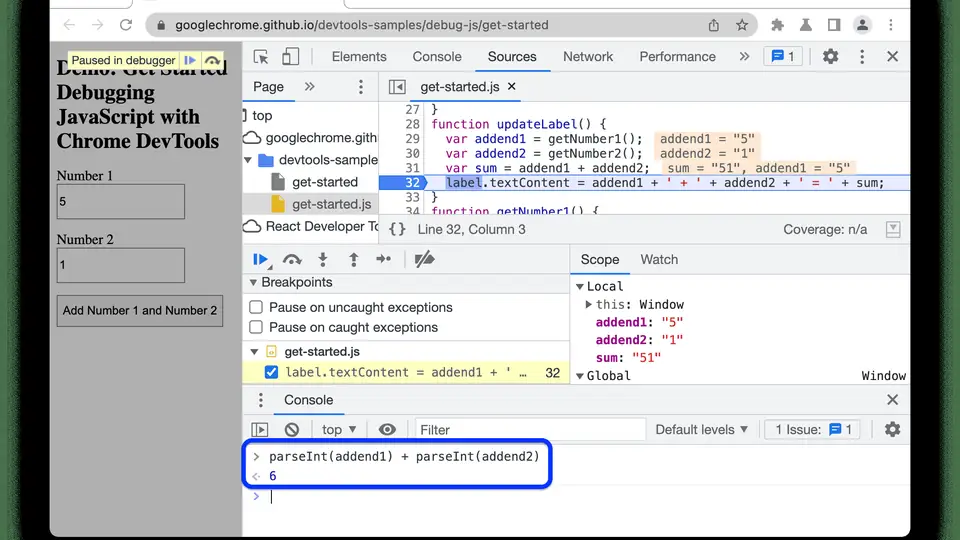
Behind that sentence the agent is chaining the real tools: navigate_page, take_screenshot, list_console_messages, and list_network_requests. The key difference from before: it is reading the rendered page — what your users actually get — not just the source code.
4. Close the debug loop
Now let the agent fix what it finds. A signup flow that misbehaves is the classic case:
Click the signup button, fill the form with [email protected] / Password1!,
submit it, and tell me what happens.
That exercises click, fill_form, and press_key — the server uses Puppeteer for input automation and waits for action results automatically. When the form breaks, the agent reads the console error itself, edits the code, and re-tests. The screenshot-paste loop you used to do by hand now happens inside the agent.
5. Audits and performance
Two heavier tools round out the kit. For a one-shot health check:
Run a Lighthouse audit on my homepage and summarize the top three fixes.That is the lighthouse_audit tool. And after a recorded trace, performance_analyze_insight turns trace data into prioritized insights. If all you want is navigation and screenshots — say, a cheap browser operator rather than the full debugger — re-run the install with --slim (and --headless) to shrink the tool surface to the basics.
6. Lock down the privacy settings
Read this before you connect it to anything real. Three defaults to know about:
- Usage statistics are on by default. Google collects tool invocation success rates, latency, and environment info. Opt out with the
--no-usage-statisticsflag, or setCHROME_DEVTOOLS_MCP_NO_USAGE_STATISTICS— settingCIdisables it too. - Performance tools can send trace URLs to the CrUX API to pull real-user experience data. Disable that with
--no-performance-crux. - The browser is exposed. The README's disclaimer is blunt: the server exposes the browser instance's content to the MCP client — it can inspect, debug, and modify any data in it. Do not hand it a browser profile with your logged-in banking session.
What you built
A coding agent with working eyes. It navigates pages, takes screenshots, reads the console, inspects network traffic, records performance traces, and runs Lighthouse audits — all from a chat window, with the same DevTools surface you would reach for yourself. The difference shows up the next time a layout breaks: instead of you hunting the error and pasting it back, the agent sees the broken render first.
Honest limitations
- Chrome only, officially. Google Chrome and Chrome for Testing are supported; anything else Chromium-based "may work, but this is not guaranteed." It runs where you run it — this is a local debugging channel, not a CI harness; for repeatable automated checks, script Playwright or Puppeteer directly.
- Telemetry defaults to on. See step 6. The privacy policy link is in the README — read it if you are wiring this into client work.
- Young but fast-moving. The project is roughly a year old, at version 1.x, shipping steadily. Pin
[email protected]instead of@latestif you want reproducible installs.