Give your coding agent a browser: hands-on with chrome-devtools-mcp
Your coding agent can read your code, run your tests, and edit your files — but until now it could not see your app the way a user does. Chrome's official DevTools MCP server fixes that: it hands the agent a real browser, with the full power of DevTools behind it. Here is the install, the setup, and a first run we verified end to end.
- What it is: the official Chrome DevTools MCP server from the ChromeDevTools team — an MCP server plus a CLI that drives a real Chrome browser.
- Why it is trending: 56,691 stars, 4,794 forks, 65 releases, and a spot on GitHub's daily trending list on November 15, 2026 — the week coding agents moved from editing code to verifying it in the browser.
- Cost: free and open source (Apache-2.0). No account, no API key; you pay only for the model your MCP client runs.
- Verified in this tutorial: every command below ran in our sandbox — install, MCP handshake, navigation, snapshot, console errors, click, form fill, screenshot, a 336 ms LCP trace, and a Lighthouse audit.

Coding agents have a blind spot. They can write a React component, run the test suite, and declare the job done — while the page throws a console error, the button does nothing when clicked, and the hero image takes three seconds to appear. The agent never sees any of it, because it has no browser.
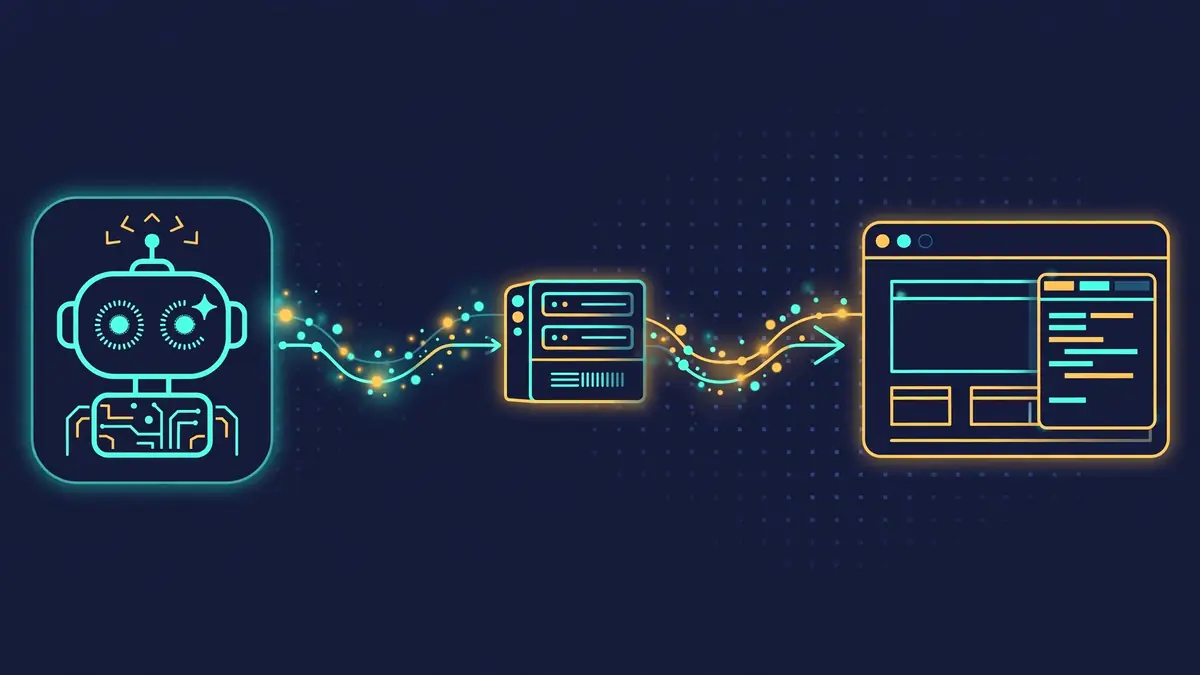
chrome-devtools-mcp closes that gap. It is the official Chrome DevTools MCP server, built by the ChromeDevTools team: a Model Context Protocol server (plus a terminal CLI) that lets an agent control and inspect a live Chrome browser. The agent can open pages, click elements, fill forms, read console messages with source-mapped stack traces, record performance traces, and run Lighthouse audits — the same tools a human developer reaches for, now callable by the model doing the work.
The numbers explain why it is on GitHub's trending page today: 56,691 stars, 4,794 forks, 65 releases, and an active repo (1,613 commits) maintained by the team that ships Chrome itself. This is not a weekend wrapper around Puppeteer. It is the browser vendor's own answer to the question of how agents should drive the web.
This tutorial installs version 1.13.0, wires it into an MCP client, and then verifies the whole loop twice: once through the agent-facing MCP server, and once through the terminal CLI against a demo page you can reproduce exactly. Every command and every quoted output below ran in our sandbox on November 15, 2026.
What you'll need#
- Node.js LTS and npm. The server ships as an npm package; no other runtime is needed.
- Google Chrome, current stable or newer — or Chrome for Testing, which the server can download for you (see the troubleshooting note in step 2).
- An MCP client for the agent half of this tutorial: Claude Code, Cursor, VS Code Copilot, Antigravity, or Gemini CLI. The CLI half needs no client at all.
- No account, no API key, no GPU. The server runs locally and costs nothing. The only bill is whatever your MCP client charges for model calls.
1. Install the server#
Install the package globally. The @latest tag keeps you on the current release; pin a version in production scripts.
npm i chrome-devtools-mcp@latest -g
chrome-devtools status # check if install worked.
Our run installed version 1.13.0 in about three seconds, and chrome-devtools status answered:
chrome-devtools-mcp daemon is not running.That is the expected answer on a fresh install — there is no daemon yet. The CLI starts one automatically the first time you call a tool that needs a browser, and reuses it for later commands, preserving open pages and cookies between calls. You can also manage it explicitly with chrome-devtools start and chrome-devtools stop.
Before going further, confirm the MCP server itself answers. It speaks MCP over standard input/output, so you can shake its hand without any browser at all. We sent it an initialize request and it replied with its identity and a tool list:
{"serverInfo": {"name": "chrome_devtools", "title": "Chrome DevTools MCP server", "version": "1.13.0"}}The tool list it returned includes click, close_page, drag, emulate, and the rest of the browser surface — the same tools the CLI exposes. If your install answers this way, the server is healthy; anything that fails later is a browser or client problem, not an install problem.
2. Connect it to your coding agent#
The README's generic configuration works in any MCP client:
{
  "mcpServers": {
    "chrome-devtools": {
      "command": "npx",
      "args": ["-y", "chrome-devtools-mcp@latest"]
    }
  }
}
Using chrome-devtools-mcp@latest means the client always picks up the newest release. The server starts the browser automatically the first time the client uses a tool that needs one; connecting alone does not launch Chrome.
The project also ships the server and its skills as a plugin, which is the fastest path in the three clients that support it:
- Claude Code: run
/plugin marketplace add ChromeDevTools/chrome-devtools-mcp, then/plugin install chrome-devtools-mcp@chrome-devtools-plugins. - Copilot / VS Code: run Chat: Install Plugin From Source and enter
ChromeDevTools/chrome-devtools-mcp. - Gemini CLI: run
gemini extensions install --auto-update https://github.com/ChromeDevTools/chrome-devtools-mcp.
The plugin also installs seven skills that teach your agent how to use the tools: chrome-devtools, chrome-devtools-cli, a11y-debugging, cookie-debugging, debug-optimize-lcp, memory-leak-debugging, and troubleshooting. If your agent does not support plugins, install the skills manually by copying the skill folders from the npm package into your agent's skills directory — for Claude Code, that is ~/.claude/skills/ — and update them each time you update the server, since skills describe the tools of a specific version.
Test the wiring with the README's own first prompt:
Check the performance of https://developers.chrome.comYour client should open the browser and record a performance trace. If it does, the agent loop is live — the rest of this tutorial is about what to do with it.
Two defaults worth knowing. Google collects usage statistics (tool invocation success rates, latency, environment information) and this is enabled by default; opt out with the --no-usage-statistics flag. Performance tools may send trace URLs to Google's CrUX API to fetch real-user experience data; disable that with --no-performance-crux. And the server exposes the browser's content to the MCP client, so do not point it at a profile holding sessions you would not want the model to read. The default isolated profile is the safe choice for agent work.
3. Drive the browser from the terminal#
The same package includes a chrome-devtools CLI that drives the browser from your terminal — no MCP client, no agent, no model calls. This is the fastest way to learn the tool surface, and it is how we verified everything in this tutorial. The CLI is a client of a background daemon (Unix sockets on Linux and macOS, named pipes on Windows); the first tool call starts the daemon and the browser, and later calls reuse them.
Build the demo page first. Save this as test-page.html and serve it locally — every output quoted in this section comes from this exact page, so you can reproduce each one:
<!doctype html>
<html lang="en">
<head><meta charset="utf-8"><title>CDTMCP demo page</title></head>
<body>
<h1>Demo page for chrome-devtools-mcp</h1>
<p id="status">Not clicked yet.</p>
<button id="cta">Click me</button>
<form id="search-form"><label>Query <input id="q" name="q" type="text"></label>
<button type="submit">Search</button></form>
<img src="hero.png" width="600" height="200">
<script>
console.warn('demo warning: slow hero image');
console.error('demo error: /api/missing returned 404');
document.getElementById('cta').addEventListener('click', () => {
  document.getElementById('status').textContent = 'Button was clicked.';
});
document.getElementById('search-form').addEventListener('submit', (e) => {
  e.preventDefault();
  document.getElementById('status').textContent = 'Searched for: ' + document.getElementById('q').value;
});
</script>
</body>
</html>
The page is deliberately imperfect: it logs a warning and an error, its image has no alt text, and it has no main landmark or meta description. Those flaws are the point — they give the debugging tools something to find. Serve the folder with python3 -m http.server 8123, then open a page and navigate to it:
chrome-devtools new_page "https://example.com"
chrome-devtools navigate_page 1 --url "http://127.0.0.1:8123/test-page.html"
Our run answered:
Successfully navigated to http://127.0.0.1:8123/test-page.html.
## Pages
1: CDTMCP demo page (http://127.0.0.1:8123/test-page.html) [selected]
Page-scoped tools take the page id as their first positional argument — here, 1. Now take a snapshot. This is the tool that makes the CLI usable: it returns the page as a text tree with a UID for every element, and every later interaction addresses elements by UID instead of by fragile CSS selectors.
chrome-devtools take_snapshot 1## Latest page snapshot
uid=1_0 RootWebArea "CDTMCP demo page" url="http://127.0.0.1:8123/test-page.html"
uid=1_1 heading "Demo page for chrome-devtools-mcp" level="1"
uid=1_2 "Not clicked yet."
uid=1_3 button "Click me"
uid=1_4 form
uid=1_5 "Query "
uid=1_6 textbox "Query"
uid=1_7 button "Search"4. Read the console, click, and type#
With the snapshot in hand, the debugging loop is three commands. First, the console — the first thing a developer checks on a broken page, and the first thing an agent should check too:
chrome-devtools list_console_messages 1## Console messages
Showing 1-3 of 3 (Page 1 of 1).
msgid=1 [warn] demo warning: slow hero image (1 args)
msgid=2 [error] demo error: /api/missing returned 404 (1 args)
msgid=3 [error] Failed to load resource: the server responded with a status of 404 (File not found) (0 args)All three messages the demo page produces are there, with severity and message ids you can fetch individually with get_console_message. The third one is the browser's own report of the missing /api/missing request — the kind of error that shows up in production while the test suite stays green.
Next, run JavaScript in the page and interact with it. evaluate_script takes a function and returns JSON, so whatever you check has to be JSON-serializable:
chrome-devtools evaluate_script "() => document.title" --pageId 1
chrome-devtools click 1 1_3
chrome-devtools evaluate_script "() => document.getElementById('status').textContent" --pageId 1
Script ran on page and returned:
```json
"CDTMCP demo page"
```
Successfully clicked on the element
Script ran on page and returned:
```json
"Button was clicked."
```The click is real: the page's own handler ran and the status text changed. Fill the form the same way — fill types into an input by UID, then click the submit button:
chrome-devtools fill 1 1_6 "chrome-devtools-mcp"
chrome-devtools click 1 1_7
chrome-devtools evaluate_script "() => document.getElementById('status').textContent" --pageId 1
Successfully filled out the element
Successfully clicked on the element
Script ran on page and returned:
```json
"Searched for: chrome-devtools-mcp"
```Finish with a screenshot, so you — or the agent — can see the page as it actually renders:
chrome-devtools take_screenshot 1 --filePath shot-demo.pngTook a screenshot of the current page's viewport.
Saved screenshot to /home/hatch/workspace/tmp-cdtmcp/shot-demo.png.Our screenshot landed as an 84,740-byte PNG. That completes the core loop an agent needs to verify its own work: navigate, snapshot, read errors, interact, assert state, screenshot. The agent that built the page can now check the page — and when the check fails, it has the console output and the screenshot to debug with instead of a guess.
5. Measure performance with a trace#
Console errors tell you what broke. A performance trace tells you what is slow — and, more usefully, why. The trace command reloads the page by default, records, and stops automatically, then prints an insight summary with Core Web Vitals:
chrome-devtools performance_start_trace 1 --filePath trace.jsonThe raw trace data was saved to /home/hatch/workspace/tmp-cdtmcp/trace.json.
The performance trace has been stopped.
## Summary of Performance trace findings:
URL: http://127.0.0.1:8123/test-page.html
Metrics (lab / observed):
- LCP: 336 ms, event: (eventKey: r-1674, ts: 6807188855), nodeId: 11
- LCP breakdown:
- TTFB: 7 ms
- Load delay: 11 ms
- Load duration: 30 ms
- Render delay: 288 ms
- CLS: 0.00
Metrics (field / real users): n/a – no data for this page in CrUX
Available insights:
- insight name: LCPBreakdown
- insight name: LCPDiscovery
- insight name: CacheRead the breakdown before the headline number. LCP is 336 ms, but 288 ms of it is render delay — the browser had the content and spent the time rendering it — while the network contributed almost nothing (TTFB 7 ms, load 30 ms). On a real page that split points at render-blocking work or a late-discovered hero image, not at the server. The raw trace (658,093 bytes of JSON in our run) is saved alongside for deeper analysis, and performance_analyze_insight drills into any named insight from the summary.
Two flags change the measurement. --reload false traces the page as it stands instead of reloading it, and --ignoreCache bypasses the HTTP cache on reload to measure a cold load. Pass --autoStop false and stop the recording yourself with performance_stop_trace when you want to capture a specific interaction instead of a page load.
6. Audit with Lighthouse#
The same server runs Lighthouse audits — in navigation mode (reload and audit) or snapshot mode (audit the current state), on desktop or mobile:
chrome-devtools lighthouse_audit 1 --mode snapshot## Lighthouse audit results
Mode: snapshot
Device: desktop
URL: http://127.0.0.1:8123/test-page.html
### Category scores
- Accessibility: 84 (accessibility)
- Best Practices: 100 (best-practices)
- SEO: 60 (seo)
- Agentic Browsing: 100 (agentic-browsing)
### Audit summary
Passed: 16
Failed: 3
Total timing: 3390.79ms
### Failed audits
- image-alt [accessibility, seo]: Image elements do not have `[alt]` attributes (score: 0)
- landmark-one-main [accessibility]: Document does not have a main landmark. (score: 0)
- meta-description [seo]: Document does not have a meta description (score: 0)Every failure the demo page was built with is caught, with the exact node named — body > img for the missing alt attribute. The audit also writes full JSON and HTML reports to a temporary directory (our run left them under /tmp/chrome-devtools-mcp-*); pass --outputDirPath to choose where they go. Note the Agentic Browsing category: Lighthouse now scores how machine-navigable a page is, which is exactly the surface this server exercises.
When you are done, stop the daemon. The browser state is discarded with it unless you passed a persistent --userDataDir:
chrome-devtools stop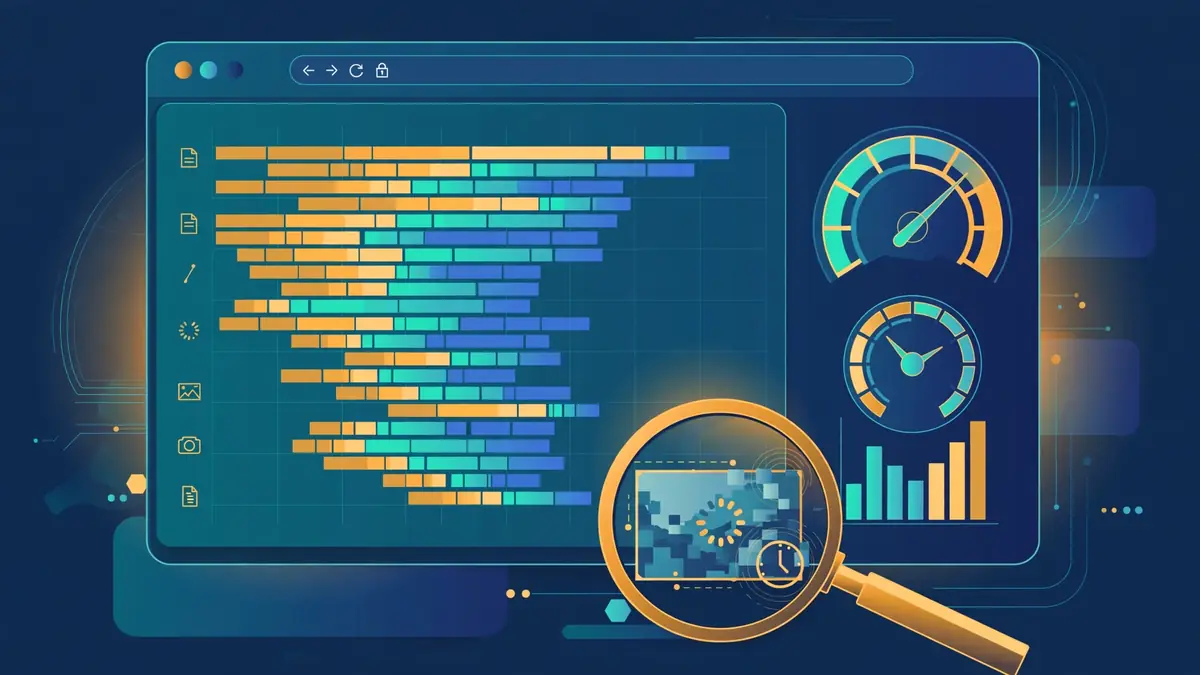
If Chrome isn't found#
On a machine with no Chrome installed, the first tool call fails with Could not find Google Chrome executable for channel 'stable'. That is what happened in our sandbox, and the fix is Chrome for Testing — the same build the server's own CI uses. Install it and point the server at it:
npx @puppeteer/browsers install chrome@stable
chrome-devtools start --executablePath "$PWD/chrome/linux-157.0.8103.78/chrome-linux64/chrome"
Our install fetched Chrome for Testing 157.0.8103.78, and the daemon started against it. Two more flags cover the awkward environments: --chromeArg=--no-sandbox if you are running as root or in a container where Chrome's sandbox cannot start, and --proxyServer=http://your-proxy:port if your network needs a proxy — Chrome does not read the shell's proxy variables. If the CLI hangs or refuses to connect, chrome-devtools stop and start again; for verbose logs, restart with NODE_DEBUG=* chrome-devtools start --logFile=/tmp/chrome-devtools.log.
When to use this vs alternatives#
Use chrome-devtools-mcp when an agent needs to verify browser behavior. The loop it enables — build, open in a real browser, read the console, click through the flow, trace the slow part — is the loop a developer runs by hand. Giving it to the agent is what turns "tests pass" into "it works in the browser". It is also the right call when the checks are DevTools-shaped: performance traces, Lighthouse scores, network inspection, accessibility audits.
Use Playwright or Puppeteer when you are writing the automation yourself. If the script is deterministic — the same clicks in the same order every run, in CI, with assertions you wrote — a script is cheaper, faster, and easier to review than an agent deciding what to click. chrome-devtools-mcp is built on Puppeteer under the hood; reach for the library when the human is the driver and the server when the model is.
Use a computer-use agent when the target is not a web page. If the job is driving a desktop app, a native dialog, or a page that resists DOM inspection, screenshot-and-mouse control is the only option. But for the web, the structured route wins: a snapshot with UIDs, a console feed, and a trace are deterministic where pixel-guessing is not, and they cost far fewer tokens than a screenshot per action.
Keep doing it by hand when the check is a one-off. Opening DevTools yourself is still the fastest way to answer a single question about a single page. The server earns its place when the loop repeats — an agent iterating on a feature, a scripted audit across pages, or a CI job that fails the build on a Lighthouse regression.
The takeaway#
The interesting thing about chrome-devtools-mcp is not that it is new — browser automation is decades old — but who ships it. The team that builds Chrome decided the way agents should drive the browser is through DevTools itself, as an MCP server, with a CLI for humans. That makes it the default answer for a specific and increasingly common job: letting the agent that wrote the code check the code in the browser where users will actually meet it.
The workflow to keep: install once with npm, connect the plugin to your coding agent, and make the first prompt a performance check. When the agent finishes a feature, the next prompt is not "does it look right?" but a trace and a Lighthouse audit — numbers the agent can act on. Our demo page went from a wall of red in the console to a 336 ms LCP with three named fixes in one short session; the same session on a real app is the difference between shipping a bug and catching it. Start with the CLI on a page you know, get comfortable with snapshots and UIDs, then hand the loop to the agent.
Sources: the chrome-devtools-mcp repository and its CLI guide. Star counts, release count, and trending placement as observed November 15, 2026; version 1.13.0 and all command outputs verified by running them in our sandbox.