Your agents can't talk to each other: build two interoperating agents with the A2A protocol — hands-on
Your coding agent answers how does X work by grepping — a dozen glob, grep, and Read calls per question, billed to you twice. CodeGraph pre-builds a knowledge graph of the whole codebase into local SQLite, so one explore call returns the symbols, the call paths, and the blast radius. This tutorial installs v1.6.1, indexes a real project, runs every query that matters, and wires the MCP server into your agent. No API key, no cloud, every command executed.

Every coding agent you have watched work has the same expensive habit: it greps. Hand it a question about an unfamiliar codebase and it fires off a dozen glob, grep, and Read calls, reconstructing the call graph in its head one file at a time — and you pay for every one of those tokens twice, once to fetch the context and once to hold it.
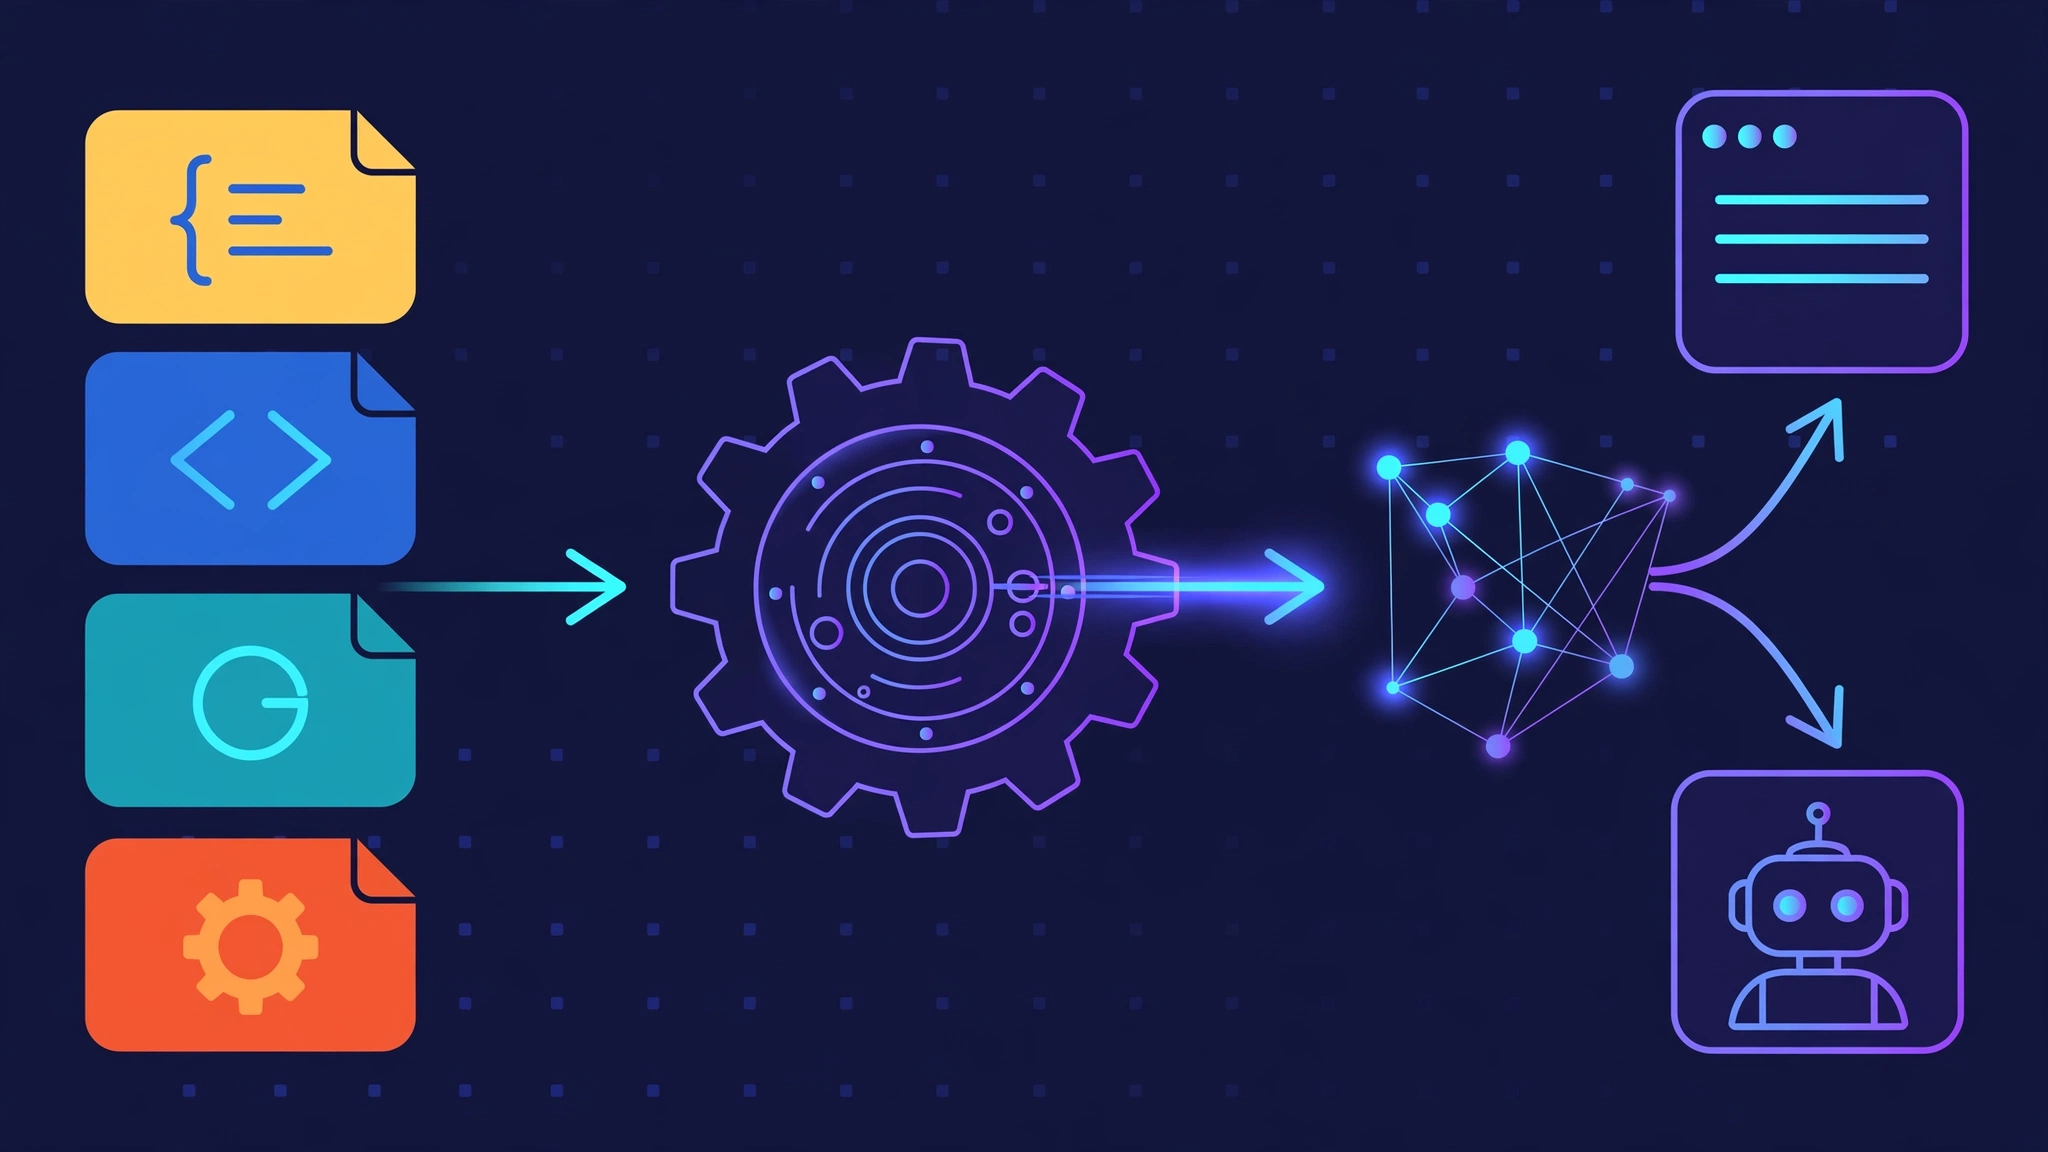
CodeGraph attacks that habit from the other end. Instead of letting the agent discover structure at query time, it pre-builds a knowledge graph of the entire codebase — every symbol, every call edge, every import — into a local SQLite database, then answers how does X work from the graph in a single call. No embeddings, no vector database, no API keys, no cloud account. It is MIT-licensed, built around a Rust parsing kernel, and it is currently one of the fastest-growing developer tools on GitHub: over 72,600 stars, 1,275 commits, 32 releases, sitting on GitHub's daily trending list the day this tutorial was written (October 1, 2026).
The claim that got it there is unusually well-documented. CodeGraph's published benchmark (re-measured August 5, 2026, on Claude Opus 4.8, seven real open-source repos, median of four runs per arm) reports 88% fewer tool calls, 53% faster answers, 62% fewer tokens, and 44% lower cost per architecture question — with the rare honest footnote that CodeGraph responses leave ~80% more retrieval context resident in the window afterward (67k vs 18k tokens on the VS Code repo). Fewer tokens burned finding the answer; a bigger answer kept around. Both true at once, and they publish the per-repo tables and the residual-context caveat in their own docs.
Every command below was executed on October 1, 2026 against CodeGraph v1.6.1 on Linux, and every output shown is real. You will install it, index a sample project, run every query that matters, and wire its MCP server into a coding agent — then decide for yourself whether it earns a place in your loop.
What you'll need #
- A Linux, macOS, or Windows machine. The CLI ships as a self-contained bundle (it vendors its own Node runtime), so nothing needs compiling and no Node.js install is required. An npm route exists if you prefer it.
- A code project to index — anything with real cross-file calls. You will build a four-file Python demo here, then point it at your own repository.
- A coding agent (Claude Code, Cursor, Codex, opencode, Gemini CLI, or similar) only for the final wiring step. Everything before that runs in a plain terminal.
- No API keys, no accounts, no GPU. Indexing is fully local. Telemetry is on by default and takes one command to disable — covered in Step 7.
Step 1 — Install CodeGraph #
Two routes, both current as of v1.6.1. Route A is the one-liner from the project's README: it downloads the release bundle for your OS and architecture, drops it in ~/.codegraph, and symlinks codegraph onto your PATH:
curl -fsSL https://raw.githubusercontent.com/colbymchenry/codegraph/main/install.sh | shRoute B is npm, if that is how you manage CLI tools:
npm i -g @colbymchenry/codegraphVerify the install:
codegraph --version
# 1.6.1
One environment note: on some containerized or restricted systems the installer's tar extraction can fail on file ownership. If the one-liner errors out during extraction, use the npm route instead — same binary, no extraction quirks.
Step 2 — Index your first project #
You need a project with genuine cross-file relationships for the graph to be interesting. Build this four-file Python task tracker — it takes thirty seconds and every later step runs against it:
mkdir -p taskflow && cd taskflowmodels.py — the domain:
"""Domain models for the task tracker."""
from dataclasses import dataclass, field
from datetime import datetime

@dataclass
class Task:
    title: str
    done: bool = False
    created_at: datetime = field(default_factory=datetime.utcnow)

    def mark_done(self):
        self.done = True

    def is_overdue(self, deadline: datetime) -> bool:
        return not self.done and datetime.utcnow() > deadline
storage.py — persistence:
"""JSON-file persistence layer."""
import json
import os
from models import Task

DB_PATH = os.path.join(os.path.dirname(__file__), "tasks.json")

def load_tasks():
    if not os.path.exists(DB_PATH):
        return []
    with open(DB_PATH) as f:
        raw = json.load(f)
    return [Task(**item) for item in raw]

def save_tasks(tasks):
    with open(DB_PATH, "w") as f:
        json.dump([t.__dict__ for t in tasks], f, default=str)
service.py — business logic:
"""Business logic: the only place tasks get created or completed."""
from models import Task
from storage import load_tasks, save_tasks

def add_task(title: str) -> Task:
    tasks = load_tasks()
    task = Task(title=title)
    tasks.append(task)
    save_tasks(tasks)
    return task

def complete_task(index: int) -> Task:
    tasks = load_tasks()
    task = tasks[index]
    task.mark_done()
    save_tasks(tasks)
    return task

def list_open_tasks():
    return [t for t in load_tasks() if not t.done]
cli.py — the entry point:
"""Command-line interface."""
import sys
from service import add_task, complete_task, list_open_tasks

def main(argv):
    cmd = argv[1] if len(argv) > 1 else "list"
    if cmd == "add":
        task = add_task(" ".join(argv[2:]))
        print(f"added: {task.title}")
    elif cmd == "done":
        task = complete_task(int(argv[2]))
        print(f"completed: {task.title}")
    else:
        for i, t in enumerate(list_open_tasks()):
            print(f"{i}. {t.title}")

if __name__ == "__main__":
    main(sys.argv)
Now build the index. One command, from the project root:
codegraph initReal output:
◆  Initialized in /home/hatch/.../taskflow
Scanning files...
Parsing code...
Resolving refs...
Linking dynamic dispatch...
◆  Indexed 4 files
●  23 nodes, 40 edges in 1.1s
Four files became 23 nodes (classes, functions, methods, imports, variables, files) and 40 edges (calls, imports, definitions) in just over a second. The index lives in .codegraph/codegraph.db — a plain SQLite database, 0.18 MB for this demo. Inspect what you built:
codegraph statusCodeGraph Status
Project: /home/hatch/.../taskflow
Index Statistics:
Files: 4
Nodes: 23
Edges: 40
DB Size: 0.18 MB
Backend: node:sqlite — built-in (full WAL)
Nodes by Kind:
import 9
function 6
file 4
method 2
class 1
variable 1
✓ Index is up to dateWhat it skipped without being told: node_modules, dist, build, .git, files over 1 MB, and everything in .gitignore — so the graph is your code, not third-party noise. If you ever need to tune that, an optional codegraph.json at the project root supports exclude, include, deprioritize, and custom extension-to-language mappings. Language support is automatic from the file extension across 30 languages, from TypeScript and Python to Rust, Go, CUDA, and Solidity.
Step 3 — Ask the graph questions (this replaces grep) #
Start with symbol search. Where grep returns lines, query returns typed symbols with signatures:
codegraph query "Task"Search Results for "Task":
class Task
models.py:6
function load_tasks
storage.py:8
()
function save_tasks
storage.py:15
(tasks)
function list_open_tasks
service.py:19
()
function add_task
service.py:5
(title: str) -> Task
function complete_task
service.py:12
(index: int) -> Task
method mark_done
models.py:11
(self)Now the call graph — the thing grep fundamentally cannot give you. Who calls mark_done?
codegraph callers "mark_done"Callers of "mark_done" (1):
method Task::mark_done (python) — models.py:11
function complete_task
service.py:12And what does main call, transitively visible at a glance?
codegraph callees "main"Callees of "main" (3):
function main (python) — cli.py:5
function complete_task
service.py:12
function list_open_tasks
service.py:19
function add_task
service.py:5To read one symbol with its full caller and callee trail — source included, no separate Read step:
codegraph node "complete_task"**complete_task** (function)
**Location:** service.py:12
**Signature:** `(index: int) -> Task`
```python
12 def complete_task(index: int) -> Task:
13 tasks = load_tasks()
14 task = tasks[index]
15 task.mark_done()
16 save_tasks(tasks)
17 return task
```
**Trail — codegraph_node any of these to follow it (no Read needed)**
**Calls →** load_tasks (storage.py:8), save_tasks (storage.py:15), mark_done (models.py:11)
**Called by ←** main (cli.py:5), cli.py (cli.py:1)That last line is the whole pitch in miniature: one command, the symbol's source, everything it calls, everything that calls it. An agent doing this with grep and Read would need half a dozen round-trips to assemble the same picture.
Step 4 — See the blast radius before you edit #
Here is the end-to-end use case that justifies the index: you are about to change Task.mark_done and you want to know what breaks. Ask the graph:
codegraph impact "Task.mark_done"Impact of changing "Task.mark_done" — 4 affected symbols:
method Task::mark_done (python) — models.py:11
models.py
method mark_done:11
service.py
function complete_task:12
cli.py
function main:5
file cli.py:1The chain is exact: mark_done → complete_task → main. In a four-file demo you could hold this in your head; in an 11,000-file TypeScript monorepo you cannot, and that is precisely the codebase where this command earns its keep.
The companion command maps changed files to the tests that cover them:
codegraph affected service.pyℹ No test files affected by the changed files.Honest output for an honest situation — the demo has no tests. In a real project with a test suite, this returns the test files within reach of your change, which is the list you hand to your agent (or your CI) before merging.

Step 5 — The one-call answer: explore and context #
So far you have driven the graph by hand. The agent-facing primitive is explore: one natural-language question in, the relevant symbols' verbatim source plus the call paths between them and a blast-radius summary out. This is the exact output the MCP tool returns, so what you see here is what your agent will see:
codegraph explore "how does completing a task work"**Exploration: how does completing a task work**
Found 11 symbols across 3 files.
**Blast radius — what depends on these (update/verify before editing)**
- `complete_task` (service.py:12) — 2 callers in `cli.py`; no tests found within 3 caller hops
- `Task` (models.py:6) — 4 callers in `service.py`, `storage.py`; no tests found within 3 caller hops
- `load_tasks` (storage.py:8) — 4 callers in `service.py`; no tests found within 3 caller hops
- `save_tasks` (storage.py:15) — 3 callers in `service.py`; no tests found within 3 caller hops
- `list_open_tasks` (service.py:19) — 2 callers in `cli.py`; no tests found within 3 caller hops
**Source Code**
> The code below is the **verbatim, current on-disk source** of these files — re-read from disk on this call and line-numbered, byte-for-byte identical to what the Read tool returns. It is NOT a summary, outline, or stale cache.That quoted guarantee matters more than it looks: the source blocks are re-read from disk at call time, so the agent is never reasoning over a stale cache. Followed by the full line-numbered source of service.py, storage.py, and models.py — everything needed to answer, nothing else.
For planning a change rather than understanding one, there is context:
codegraph context "add priority field to tasks"## Code Context
**Query:** add priority field to tasks
### Entry Points
- **add_task** (function) - service.py:5
`(title: str) -> Task`
- **Task** (class) - models.py:6
- **load_tasks** (function) - storage.py:8
`()`
### Related Symbols
- storage.py: save_tasks:15, DB_PATH:6
- cli.py: main:5
- models.py: is_overdue:14, mark_done:11
- service.py: complete_task:12, list_open_tasks:19Entry points first, related symbols second, then the code — a ready-made briefing for the agent about to implement the feature. This is the command you would paste into a task prompt, or that the MCP server hands over automatically.
Step 6 — Wire it into your coding agent #
The CLI is useful on its own, but the trending use case — the one driving those 72,000 stars — is the agent loop. CodeGraph ships an MCP server, and codegraph install wires it into your agents for you. Run it and it auto-detects what you have installed:
codegraph installSupported targets, verified from the installer itself: Claude Code, Cursor, Codex CLI, opencode, Hermes Agent, Gemini CLI, Antigravity IDE, Kiro, and GitHub Copilot (VS Code, Copilot CLI, and JetBrains). For a non-interactive setup — dotfiles, containers, CI images:
codegraph install -yTo see exactly what gets written before you commit to it, print the config snippet for your agent without touching any files:
codegraph install --print-config claude# Add to /home/hatch/.claude.json
{
"mcpServers": {
"codegraph": {
"type": "stdio",
"command": "codegraph",
"args": [
"serve",
"--mcp"
],
"alwaysLoad": true
}
}
}The server itself is codegraph serve --mcp over stdio. I verified the handshake directly: initialize returns server codegraph 1.6.1, and tools/list returns exactly one tool — codegraph_explore. That singularity is deliberate, not a missing feature. The project's docs state that measured agent behavior showed one strong tool steers agents better than a menu of narrower ones: fewer mis-picks, less context spent choosing. The narrower tools (codegraph_node, codegraph_search, codegraph_callers, codegraph_callees, codegraph_impact, codegraph_files, codegraph_status) stay fully functional but unlisted — everything they return already arrives inline in an explore response — and you can re-list any of them with the CODEGRAPH_MCP_TOOLS environment variable, e.g. CODEGRAPH_MCP_TOOLS=explore,node,search,callers.
Two details worth knowing before you rely on it daily. First, the server accepts a projectPath parameter, so one agent session can query several indexed projects — a sub-service in a monorepo, a second repo — without re-indexing. Second, a path with no index does not fail loudly; the tools return guidance to fall back to built-in tools, and indexing stays your decision.
Step 7 — Keeping the index fresh (and an honest caveat) #
CodeGraph advertises auto-sync: a file watcher updates the graph on every change, so the index is never stale. On a normal desktop install that is how it behaves. Here is what I actually observed, because the caveat is instructive: in a headless environment with no background daemon running, I appended a new function to service.py and codegraph status reported it plainly instead of silently serving stale data:
Pending Changes:
  Modified:  1 files
ℹ Run "codegraph sync" to update the index
The fix is one command, and it is fast:
codegraph sync◆ Synced 1 changed files
● Modified: 1 — 7 nodes in 115ms
└ DoneOne changed file, seven nodes updated, 115 milliseconds — and a query for the new function immediately resolves. The takeaway for your setup: on a developer workstation the watcher handles this invisibly; in containers, CI, or remote dev boxes, put codegraph sync in your workflow (a git hook or a pre-prompt step) and treat a Pending Changes status as the signal it is.
A related housekeeping note: CodeGraph collects anonymous usage statistics by default — which commands run, which languages get indexed — to guide development. Never code, paths, symbol names, queries, or IP addresses; usage is aggregated locally into daily totals before anything is sent. Disable it any time:
codegraph telemetry off # or: CODEGRAPH_TELEMETRY=0, or DO_NOT_TRACK=1When to use CodeGraph vs the alternatives #
Versus grep, glob, and Read loops: that is the thing CodeGraph replaces. If your agent answers architecture questions by crawling files, the graph collapses up to 43 tool calls into one to four explore calls (their measured range on real repos). Keep grep for one-off text searches; stop using it as an architecture-discovery strategy.
Versus ctags and language servers: complementary, not competing. An LSP answers where is this defined with perfect precision; the graph answers how does this flow work and what breaks if I touch it across file and language boundaries, in a shape an agent can consume without an editor attached. You want both; they do different jobs.
Versus vector/RAG code search: embeddings win on fuzzy semantic similarity (find code that handles retries); the graph wins on structure, determinism, and cost — zero API spend, zero embedding-model drift, and edges that reflect actual calls rather than textual similarity. For how does X reach Y questions, structure beats similarity.
Versus session-memory tools (like Context Mode, covered on this blog): different halves of the same problem. Context Mode shrinks what the agent burns holding tool output; CodeGraph shrinks what the agent needs to fetch in the first place. They coexist fine — index the structure, sandbox the output.
The takeaway #
CodeGraph earns its trending slot because it removes a real tax instead of adding a feature. Your agent's most expensive habit — rediscovering your codebase's structure on every question — becomes a one-time, one-second indexing cost plus a single explore call per question. The install is one line, the index is a local SQLite file you can inspect, there are no keys and no cloud, and the project documents both its wins and its costs with unusual candor.
Start with codegraph init on the repository you know least well. Ask it how the thing you are afraid to touch works. Check the blast radius with impact before your next refactor. If the answers change how you work, run codegraph install and let your agent ask the graph instead of grepping — that is the loop 72,000 developers starred.