See exactly what your coding agents cost: hands-on with Agent Console, the 765-star local-first token dashboard
Your coding agents burn tokens and money in the background and never tell you. Agent Console reads the session transcripts Claude Code and Codex already write on your disk and turns them into one local dashboard — tokens by class, per-model cost estimates, live burn rate, and alerts for spikes and runaway tool loops. No account, no telemetry, nothing leaves your machine. This tutorial installs it (from source and from the signed v0.4.1 release), tours the demo, points it at your real sessions, and connects a second machine to a team hub.
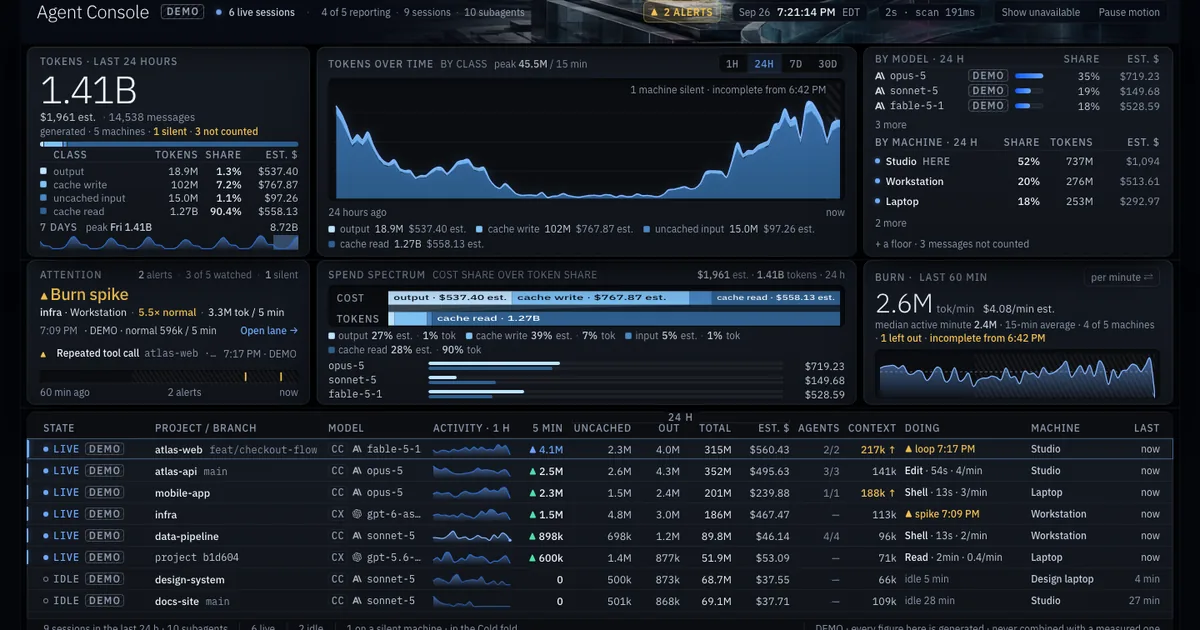
You have no idea what your coding agents cost you. Claude Code sessions run for hours, spinning up subagents, retrying tool calls, re-reading files — and the bill arrives as a single number at the end of the month. Somewhere in between, a runaway loop burned a dollar a minute and nobody noticed.
Agent Console by LockedIn Labs fixes the blindness without any cloud service. It's an open-source (MIT), local-first dashboard that reads the session transcripts Claude Code and Codex already write on your machine and shows you, per session, per model, and per machine: tokens split by class (output, cache write, uncached input, cache read), list-price cost estimates, live burn rate in tokens per minute and dollars per hour, and alerts for burn spikes and repeated tool calls. It picked up 765 GitHub stars in eleven days — a sign the pain is widely felt.
This tutorial installs it two ways, tours the demo, points it at your real sessions, joins a second machine to a team hub, and wires the numbers into Prometheus and Grafana. Every command below was executed on October 1, 2026 against the v0.4.1 release (published September 27, 2026).
What you'll need #
- Node.js 22 or newer — check with
node --version. Grab the LTS build from nodejs.org if you're short. - Git (only for the source route) or a browser to download the release archive.
- Claude Code or Codex with some session history — or nothing at all; the
--demoflag generates a synthetic team so you can look around first. - About 15 minutes. There is no account to create, no package to install, and no build step.
Step 1 — Get Agent Console #
Two supported routes, both verified for this tutorial. The source route is fastest:
git clone https://github.com/LockedinLabs-AI/agent-console.git
cd agent-console
node bin/agent-console.mjs --open
That command runs the checkout in place, reads the Claude Code and Codex history already on this computer, and opens the console in your browser — signed in, normally at http://127.0.0.1:6787. The console binds to loopback only; nothing is reachable from the network unless you ask it to be.
Prefer an install to a checkout? The v0.4.1 release publishes a Node package archive (plus signed standalone binaries for macOS, Linux, and Windows, with SHA256SUMS, build attestations, and a CycloneDX SBOM on every release). One honest caveat from the docs, stated plainly: the @lockedinlabs/agent-console name is not published on the npm registry, the documented Homebrew tap is not verified as available, and no container image is verified — so install the published GitHub archive directly:
npm install --global --ignore-scripts https://github.com/LockedinLabs-AI/agent-console/releases/download/v0.4.1/lockedinlabs-agent-console-0.4.1.tgz
agent-console --open
(On Windows PowerShell use npm.cmd and agent-console.cmd.) Verify the install with --help — the full CLI surface, including the join, report, stop, leave, metrics-token, and policy subcommands, prints from there.
Step 2 — Look around in demo mode first #
Before pointing anything at your real data, take the tour on synthetic numbers. --demo spins up a fake team; it reads nothing and accepts no machine:
node bin/agent-console.mjs --demo --open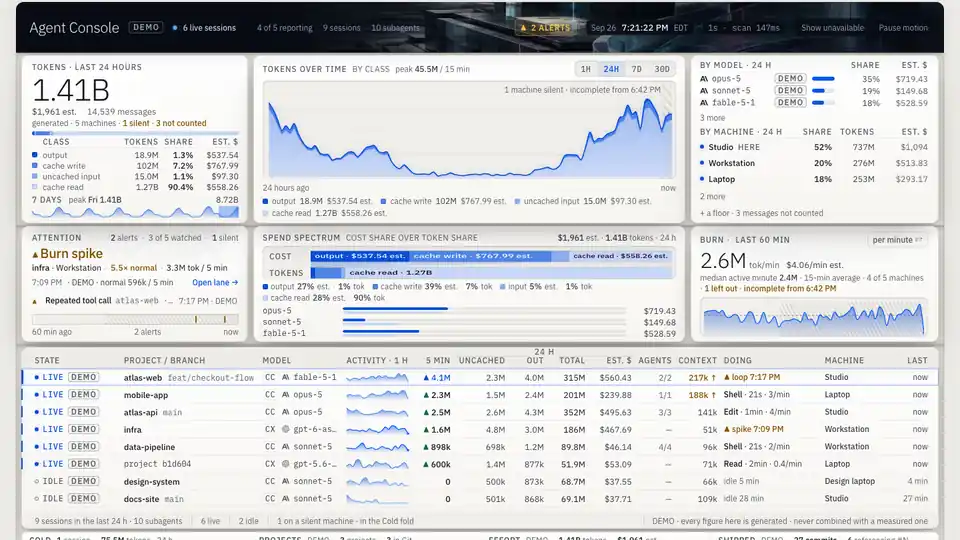
In the first thirty seconds you see: the last 24 hours of tokens (switchable to the last hour, 7 days, or 30 days), split into cache read, cache write, output, and uncached input; their list-price estimate; burn right now in tokens per minute and dollars per hour; one lane per session with its model, its subagents, and its last hour of activity; and every machine and person reporting, each with a share of the total. The ATTENTION panel is where the money insight lives: it flags burn spikes ("5.5× normal, 3.3M tok / 5 min") and repeated tool calls — exactly the runaway-loop behavior that silently inflates bills.
Note the demo figures are watermarked and the README says it plainly: estimates say they are estimates; unknown readings are shown as unknown, never as zero. That's the project's honesty policy, and it runs through the whole product.
Step 3 — Point it at your real sessions #
Drop --demo and run it for real:
node bin/agent-console.mjs --openThe console finds transcripts where the agents put them, no configuration: Claude Code's CLAUDE_CONFIG_DIR (its projects folder) when set, otherwise ~/.claude/projects and ~/.config/claude/projects; Codex's CODEX_HOME (its sessions folder, plus archived_sessions) when set, otherwise ~/.codex/sessions with ~/.codex/archived_sessions. It re-reads every 2 seconds (--poll-ms), keeps 8 days of history by default (--retention-days, 1–90), and tells you in the window which folders it read — or says plainly when it found nothing.
Non-standard layout? Override the transcript roots directly:
node bin/agent-console.mjs --open --claude-root ~/work/claude-data --codex-root ~/work/codex-dataUseful options for a machine you run daily: --name and --person label this computer on the console, and --port moves the console off its default 6787 (always 127.0.0.1-only; the reporting port sits one above it at 6788). Every option also has an environment-variable twin (AGENT_CONSOLE_PORT, AGENT_CONSOLE_RETENTION_DAYS, …) for service-managed setups. Run node bin/agent-console.mjs --help for the complete table.
Step 4 — Read the numbers like a cost engineer #
Now the part that pays for the fifteen minutes. Three views matter:
- Tokens by class. Cache reads are typically ~90% of tokens and a few percent of cost; output and cache writes are where the money goes. The spend spectrum panel shows cost share next to token share per class, which instantly tells you whether a session is spending on thinking (output) or on re-reading context (cache write).
- Burn right now. Tokens per minute and estimated dollars per hour, live. Leave this up during a long agent run; a spike you catch at minute five costs cents, the one you discover tomorrow costs dollars.
- Per-session lanes. Each lane shows the model, subagents, uncached vs. out tokens, total spend, and context size. Sort by spend to find which session — and which model — is your most expensive habit. The demo above is instructive: an opus-class model on a side task while a cheaper model does the main work is the pattern to kill.
For always-on watching, the console has desktop alerts with spike and stall detection (--desktop-alerts, --alert-spike-factor, --alert-stall-minutes) that reuse the same logic as the ATTENTION panel.
Step 5 — Present it without leaking anything #
Press P. Presenting mode replaces every project, machine, and person with a stand-in name, so you can screen-share your spend in a team meeting without broadcasting client project names:
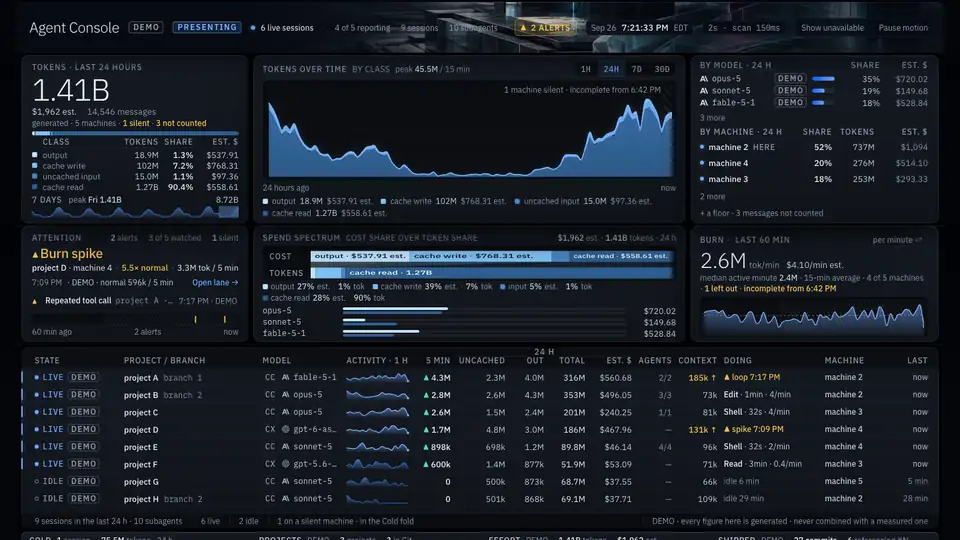
The privacy model underneath is worth stating precisely, because "local-first" gets thrown around loosely. The console itself sends nothing anywhere — no telemetry, no update check, no crash reporting, no account. When machines report to a hub, only model ids, minute timestamps, token counts, and salted hashes cross the wire — never a prompt, a reply, a file path, or a file's contents. Three opt-ins exist and each is off unless you pass it: --share-project-names (folder names, never paths), --share-alerts, and --share-tool-activity (alerts and tool calls as kinds and counts). A test in the repo pushes transcripts full of planted canaries through the real reporter and the real hub and checks every byte that crosses the wire.
Step 6 — Add a second machine (the team hub) #
Run a laptop and a build box? One console can watch both. On the machine that hosts the console, open the join view and copy the join link; on the other machine, run:
node bin/agent-console.mjs join '<join link>'The reporter enrolls with a device token and keeps reporting after restarts (report), and stop / leave pause or end the enrolment. Each machine keeps its own lanes and nothing is counted twice. Two networking notes from the docs, quoted because they matter: the reporting port accepts joins from private networks by default; add --allow-public to open it wider, or --allow-cgnat for 100.64.0.0/10 (Tailscale, carrier-grade NAT). On a server that hosts the hub without running agents itself, --no-local stops it from reading that machine.
There's a second trick in the same CLI: policy diff|apply|remove installs a repository's agent-policy.yaml as Claude Code project files — the observability console doubling as the enforcement point for the rules your spend depends on.
Step 7 (optional) — Feed the numbers to Prometheus and Grafana #
If your org already watches infrastructure in Grafana, the console speaks that language too. Generate the scrape token:
node bin/agent-console.mjs metrics-tokenThat unlocks the /metrics Prometheus endpoint (plus optional ingest of Claude Code OpenTelemetry and Kong or LiteLLM token metrics), and the repo ships a ready-made dashboard at docs/grafana-agent-console.json. Same numbers as the console, now next to your CPU graphs.
What you built #
One local dashboard — bound to loopback, MIT-licensed, no account, no telemetry — showing every Claude Code and Codex session on your machine: tokens by class, per-model list-price cost, live burn rate, per-session lanes, and alerts for spikes and runaway tool loops. Optionally: a second machine reporting into the same view, and the whole thing mirrored into Prometheus/Grafana. Total new infrastructure: zero services, zero signups.
Honest limitations #
- Claude Code and Codex only. The console reads the transcript formats those two agents write. Cursor, Copilot, Gemini CLI, and friends aren't parsed — if your spend lives there, this won't see it.
- Costs are list-price estimates. The project labels them as estimates everywhere and shows unknown as unknown, never as zero — but they won't match negotiated rates, credits, or subscription pricing. Treat them as directional, not as an invoice.
- Young project, moving fast. 765 stars in eleven days means the docs are honest about rough edges (the npm name isn't published, the Homebrew tap is unverified, the Windows executable isn't code-signed). Pin the release you tested — v0.4.1 here — and re-check flags after upgrades.
- It only sees what's on disk. Sessions that never write local transcripts (browser-based or remote IDE variants) stay invisible, and 8 days of retention is the default — raise
--retention-daysif you want longer history.
The takeaway #
Token spend is the cloud bill of the agent era, and most teams still fly it blind. Agent Console doesn't optimize anything — it does the more important first step, which is showing you: which session, which model, which class of token, burning how fast, right now. The demo takes two minutes; the moment you see your first burn spike flagged in real time, you'll leave it running.
Run it from source this week, press P before your next screen-share, and find out which of your habits is the expensive one.